Senegalese vs Immigrants from Barbados Child Poverty Under the Age of 5
COMPARE
Senegalese
Immigrants from Barbados
Child Poverty Under the Age of 5
Child Poverty Under the Age of 5 Comparison
Senegalese
Immigrants from Barbados
20.9%
CHILD POVERTY UNDER THE AGE OF 5
0.0/ 100
METRIC RATING
281st/ 347
METRIC RANK
20.0%
CHILD POVERTY UNDER THE AGE OF 5
0.2/ 100
METRIC RATING
256th/ 347
METRIC RANK
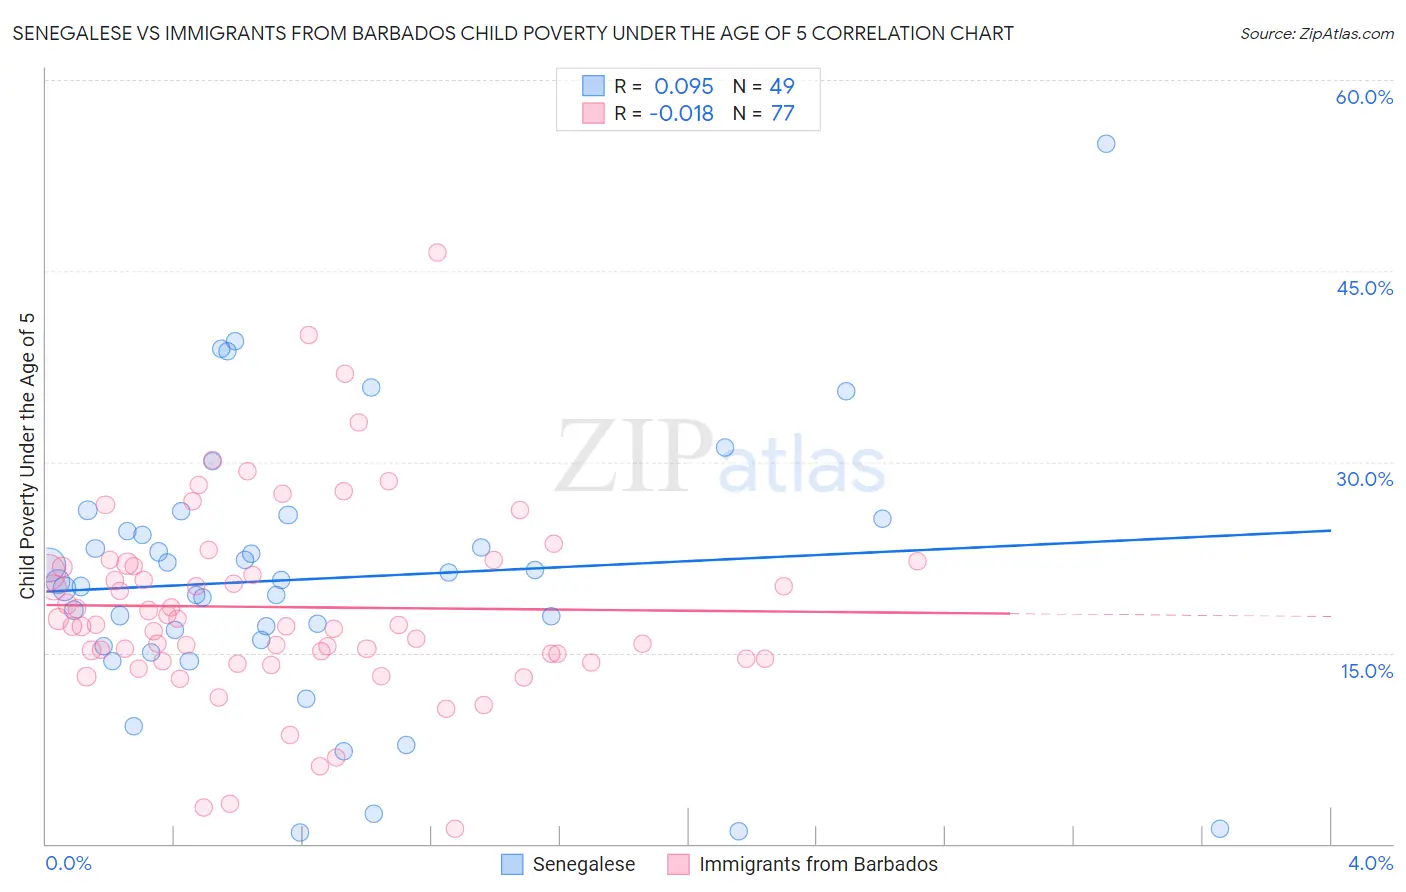
Senegalese vs Immigrants from Barbados Child Poverty Under the Age of 5 Correlation Chart
The statistical analysis conducted on geographies consisting of 77,581,902 people shows a slight positive correlation between the proportion of Senegalese and poverty level among children under the age of 5 in the United States with a correlation coefficient (R) of 0.095 and weighted average of 20.9%. Similarly, the statistical analysis conducted on geographies consisting of 111,157,881 people shows no correlation between the proportion of Immigrants from Barbados and poverty level among children under the age of 5 in the United States with a correlation coefficient (R) of -0.018 and weighted average of 20.0%, a difference of 4.6%.
Child Poverty Under the Age of 5 Correlation Summary
| Measurement | Senegalese | Immigrants from Barbados |
| Minimum | 0.87% | 1.1% |
| Maximum | 55.0% | 46.4% |
| Range | 54.1% | 45.3% |
| Mean | 20.8% | 18.6% |
| Median | 20.6% | 17.1% |
| Interquartile 25% (IQ1) | 15.8% | 14.5% |
| Interquartile 75% (IQ3) | 25.1% | 21.9% |
| Interquartile Range (IQR) | 9.3% | 7.4% |
| Standard Deviation (Sample) | 10.5% | 7.7% |
| Standard Deviation (Population) | 10.4% | 7.6% |
Similar Demographics by Child Poverty Under the Age of 5
Demographics Similar to Senegalese by Child Poverty Under the Age of 5
In terms of child poverty under the age of 5, the demographic groups most similar to Senegalese are French American Indian (20.8%, a difference of 0.23%), Potawatomi (21.0%, a difference of 0.54%), Subsaharan African (20.8%, a difference of 0.64%), Comanche (21.0%, a difference of 0.74%), and Immigrants from Grenada (20.7%, a difference of 1.0%).
| Demographics | Rating | Rank | Child Poverty Under the Age of 5 |
| Immigrants | Belize | 0.1 /100 | #274 | Tragic 20.6% |
| Bangladeshis | 0.1 /100 | #275 | Tragic 20.6% |
| West Indians | 0.0 /100 | #276 | Tragic 20.6% |
| Immigrants | West Indies | 0.0 /100 | #277 | Tragic 20.7% |
| Immigrants | Grenada | 0.0 /100 | #278 | Tragic 20.7% |
| Sub-Saharan Africans | 0.0 /100 | #279 | Tragic 20.8% |
| French American Indians | 0.0 /100 | #280 | Tragic 20.8% |
| Senegalese | 0.0 /100 | #281 | Tragic 20.9% |
| Potawatomi | 0.0 /100 | #282 | Tragic 21.0% |
| Comanche | 0.0 /100 | #283 | Tragic 21.0% |
| Somalis | 0.0 /100 | #284 | Tragic 21.1% |
| Haitians | 0.0 /100 | #285 | Tragic 21.2% |
| Immigrants | Latin America | 0.0 /100 | #286 | Tragic 21.2% |
| Immigrants | Zaire | 0.0 /100 | #287 | Tragic 21.3% |
| Immigrants | Senegal | 0.0 /100 | #288 | Tragic 21.3% |
Demographics Similar to Immigrants from Barbados by Child Poverty Under the Age of 5
In terms of child poverty under the age of 5, the demographic groups most similar to Immigrants from Barbados are Shoshone (20.0%, a difference of 0.010%), Immigrants from St. Vincent and the Grenadines (20.0%, a difference of 0.15%), Immigrants from El Salvador (20.0%, a difference of 0.17%), Immigrants from Cuba (19.9%, a difference of 0.22%), and Fijian (19.9%, a difference of 0.32%).
| Demographics | Rating | Rank | Child Poverty Under the Age of 5 |
| Immigrants | Middle Africa | 0.4 /100 | #249 | Tragic 19.7% |
| Immigrants | Nonimmigrants | 0.4 /100 | #250 | Tragic 19.7% |
| Pennsylvania Germans | 0.3 /100 | #251 | Tragic 19.8% |
| Immigrants | Nicaragua | 0.3 /100 | #252 | Tragic 19.8% |
| Mexican American Indians | 0.3 /100 | #253 | Tragic 19.9% |
| Fijians | 0.3 /100 | #254 | Tragic 19.9% |
| Immigrants | Cuba | 0.2 /100 | #255 | Tragic 19.9% |
| Immigrants | Barbados | 0.2 /100 | #256 | Tragic 20.0% |
| Shoshone | 0.2 /100 | #257 | Tragic 20.0% |
| Immigrants | St. Vincent and the Grenadines | 0.2 /100 | #258 | Tragic 20.0% |
| Immigrants | El Salvador | 0.2 /100 | #259 | Tragic 20.0% |
| Spanish Americans | 0.2 /100 | #260 | Tragic 20.1% |
| Immigrants | Bangladesh | 0.2 /100 | #261 | Tragic 20.1% |
| Liberians | 0.1 /100 | #262 | Tragic 20.2% |
| Barbadians | 0.1 /100 | #263 | Tragic 20.2% |