Scottish vs Assyrian/Chaldean/Syriac Female Poverty Among 25-34 Year Olds

COMPARE

Scottish
Race
Ancestry
AfghanAfricanAlaska NativeAlaskan AthabascanAlbanianAleutAlsatianAmericanApacheArabArapahoArgentineanArmenianAustralianAustrianBahamianBangladeshiBarbadianBasqueBelgianBelizeanBermudanBhutaneseBlackfeetBolivianBrazilianBritishBritish West IndianBulgarianBurmeseCajunCambodianCanadianCape VerdeanCarpatho RusynCelticCentral AmericanCentral American IndianCherokeeCheyenneChickasawChileanChineseChippewaChoctawColombianColvilleComancheCosta RicanCreeCreekCroatianCrowCubanCypriotCzechCzechoslovakianDanishDelawareDominicanDutchDutch West IndianEastern EuropeanEcuadorianEgyptianEnglishEstonianEthiopianEuropeanFijianFilipinoFinnishFrenchFrench American IndianFrench CanadianGermanGerman RussianGhanaianGreekGuamanian/ChamorroGuatemalanGuyaneseHaitianHmongHonduranHopiHoumaHungarianIcelanderIndian (Asian)IndonesianInupiatIranianIraqiIrishIroquoisIsraeliItalianJamaicanJapaneseJordanianKenyanKiowaKoreanLaotianLatvianLebaneseLiberianLithuanianLumbeeLuxembourgerMacedonianMalaysianMalteseMarshalleseMenomineeMexicanMexican American IndianMongolianMoroccanNative HawaiianNavajoNepaleseNew ZealanderNicaraguanNigerianNorthern EuropeanNorwegianOkinawanOsageOttawaPaiutePakistaniPalestinianPanamanianParaguayanPennsylvania GermanPeruvianPimaPolishPortuguesePotawatomiPuebloPuerto RicanPuget Sound SalishRomanianRussianSalvadoranSamoanScandinavianScotch-IrishScottishSeminoleSenegaleseSerbianShoshoneSierra LeoneanSiouxSlavicSlovakSloveneSomaliSouth AfricanSouth AmericanSouth American IndianSoviet UnionSpaniardSpanishSpanish AmericanSpanish American IndianSri LankanSubsaharan AfricanSudaneseSwedishSwissSyrianTaiwaneseThaiTlingit-HaidaTohono O'OdhamTonganTrinidadian and TobagonianTsimshianTurkishU.S. Virgin IslanderUgandanUkrainianUruguayanUteVenezuelanVietnameseWelshWest IndianYakamaYaquiYugoslavianYumanYup'ikZimbabwean
Immigration
NonimmigrantsImmigrantsAfghanistanAfricaAlbaniaArgentinaArmeniaAsiaAustraliaAustriaBahamasBangladeshBarbadosBelarusBelgiumBelizeBoliviaBosnia and HerzegovinaBrazilBulgariaBurma/MyanmarCabo VerdeCambodiaCameroonCanadaCaribbeanCentral AmericaChileChinaColombiaCongoCosta RicaCroatiaCubaCzechoslovakiaDenmarkDominicaDominican RepublicEastern AfricaEastern AsiaEastern EuropeEcuadorEgyptEl SalvadorEnglandEritreaEthiopiaEuropeFijiFranceGermanyGhanaGreeceGrenadaGuatemalaGuyanaHaitiHondurasHong KongHungaryIndiaIndonesiaIranIraqIrelandIsraelItalyJamaicaJapanJordanKazakhstanKenyaKoreaKuwaitLaosLatin AmericaLatviaLebanonLiberiaLithuaniaMalaysiaMexicoMicronesiaMiddle AfricaMoldovaMoroccoNepalNetherlandsNicaraguaNigeriaNorth AmericaNorth MacedoniaNorthern AfricaNorthern EuropeNorwayOceaniaPakistanPanamaPeruPhilippinesPolandPortugalRomaniaRussiaSaudi ArabiaScotlandSenegalSerbiaSierra LeoneSingaporeSomaliaSouth AfricaSouth AmericaSouth Central AsiaSouth Eastern AsiaSouthern EuropeSpainSri LankaSt. Vincent and the GrenadinesSudanSwedenSwitzerlandSyriaTaiwanThailandTrinidad and TobagoTurkeyUgandaUkraineUruguayUzbekistanVenezuelaVietnamWest IndiesWestern AfricaWestern AsiaWestern EuropeYemenZaireZimbabweAzores
Assyrian/Chaldean/Syriac
Race
Ancestry
AfghanAfricanAlaska NativeAlaskan AthabascanAlbanianAleutAlsatianAmericanApacheArabArapahoArgentineanArmenianAssyrian/Chaldean/SyriacAustralianAustrianBahamianBangladeshiBarbadianBasqueBelgianBelizeanBermudanBhutaneseBlackfeetBolivianBrazilianBritishBritish West IndianBulgarianBurmeseCajunCambodianCanadianCape VerdeanCarpatho RusynCelticCentral AmericanCentral American IndianCherokeeCheyenneChickasawChileanChineseChippewaChoctawColombianColvilleComancheCosta RicanCreeCreekCroatianCrowCubanCypriotCzechCzechoslovakianDanishDelawareDominicanDutchDutch West IndianEastern EuropeanEcuadorianEgyptianEnglishEstonianEthiopianEuropeanFijianFilipinoFinnishFrenchFrench American IndianFrench CanadianGermanGerman RussianGhanaianGreekGuamanian/ChamorroGuatemalanGuyaneseHaitianHmongHonduranHopiHoumaHungarianIcelanderIndian (Asian)IndonesianInupiatIranianIraqiIrishIroquoisIsraeliItalianJamaicanJapaneseJordanianKenyanKiowaKoreanLaotianLatvianLebaneseLiberianLithuanianLumbeeLuxembourgerMacedonianMalaysianMalteseMarshalleseMenomineeMexicanMexican American IndianMongolianMoroccanNative HawaiianNavajoNepaleseNew ZealanderNicaraguanNigerianNorthern EuropeanNorwegianOkinawanOsageOttawaPaiutePakistaniPalestinianPanamanianParaguayanPennsylvania GermanPeruvianPimaPolishPortuguesePotawatomiPuebloPuerto RicanPuget Sound SalishRomanianRussianSalvadoranSamoanScandinavianScotch-IrishSeminoleSenegaleseSerbianShoshoneSierra LeoneanSiouxSlavicSlovakSloveneSomaliSouth AfricanSouth AmericanSouth American IndianSoviet UnionSpaniardSpanishSpanish AmericanSpanish American IndianSri LankanSubsaharan AfricanSudaneseSwedishSwissSyrianTaiwaneseThaiTlingit-HaidaTohono O'OdhamTonganTrinidadian and TobagonianTsimshianTurkishU.S. Virgin IslanderUgandanUkrainianUruguayanUteVenezuelanVietnameseWelshWest IndianYakamaYaquiYugoslavianYumanYup'ikZimbabwean
Immigration
NonimmigrantsImmigrantsAfghanistanAfricaAlbaniaArgentinaArmeniaAsiaAustraliaAustriaBahamasBangladeshBarbadosBelarusBelgiumBelizeBoliviaBosnia and HerzegovinaBrazilBulgariaBurma/MyanmarCabo VerdeCambodiaCameroonCanadaCaribbeanCentral AmericaChileChinaColombiaCongoCosta RicaCroatiaCubaCzechoslovakiaDenmarkDominicaDominican RepublicEastern AfricaEastern AsiaEastern EuropeEcuadorEgyptEl SalvadorEnglandEritreaEthiopiaEuropeFijiFranceGermanyGhanaGreeceGrenadaGuatemalaGuyanaHaitiHondurasHong KongHungaryIndiaIndonesiaIranIraqIrelandIsraelItalyJamaicaJapanJordanKazakhstanKenyaKoreaKuwaitLaosLatin AmericaLatviaLebanonLiberiaLithuaniaMalaysiaMexicoMicronesiaMiddle AfricaMoldovaMoroccoNepalNetherlandsNicaraguaNigeriaNorth AmericaNorth MacedoniaNorthern AfricaNorthern EuropeNorwayOceaniaPakistanPanamaPeruPhilippinesPolandPortugalRomaniaRussiaSaudi ArabiaScotlandSenegalSerbiaSierra LeoneSingaporeSomaliaSouth AfricaSouth AmericaSouth Central AsiaSouth Eastern AsiaSouthern EuropeSpainSri LankaSt. Vincent and the GrenadinesSudanSwedenSwitzerlandSyriaTaiwanThailandTrinidad and TobagoTurkeyUgandaUkraineUruguayUzbekistanVenezuelaVietnamWest IndiesWestern AfricaWestern AsiaWestern EuropeYemenZaireZimbabweAzores
Female Poverty Among 25-34 Year Olds
Income
Poverty
Unemployment
Labor Participation
Family Structure
Vehicle Availability
Education Level
Disability

Female Poverty Among 25-34 Year Olds Comparison

Scottish

Assyrians/Chaldeans/Syriacs

Fair
Exceptional
13.9%
FEMALE POVERTY AMONG 25-34 YEAR OLDS
23.6/ 100
METRIC RATING
196th/ 347
METRIC RANK
11.2%
FEMALE POVERTY AMONG 25-34 YEAR OLDS
100.0/ 100
METRIC RATING
15th/ 347
METRIC RANK

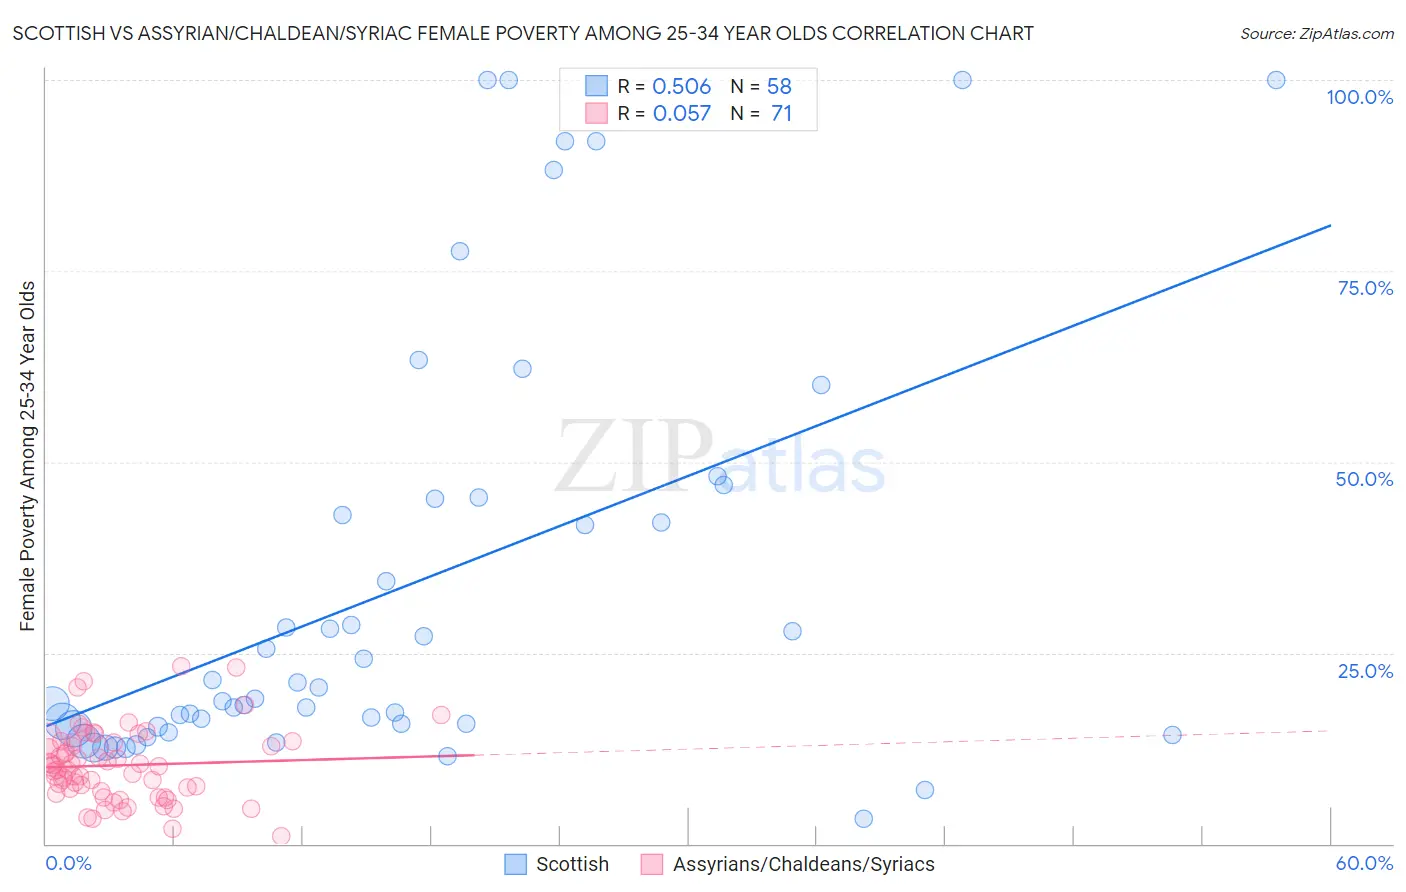
Scottish vs Assyrian/Chaldean/Syriac Female Poverty Among 25-34 Year Olds Correlation Chart

The statistical analysis conducted on geographies consisting of 544,896,820 people shows a substantial positive correlation between the proportion of Scottish and poverty level among females between the ages 25 and 34 in the United States with a correlation coefficient (R) of 0.506 and weighted average of 13.9%. Similarly, the statistical analysis conducted on geographies consisting of 109,704,517 people shows a slight positive correlation between the proportion of Assyrians/Chaldeans/Syriacs and poverty level among females between the ages 25 and 34 in the United States with a correlation coefficient (R) of 0.057 and weighted average of 11.2%, a difference of 23.9%.
Scottish vs Assyrian/Chaldean/Syriac Female Poverty Among 25-34 Year Olds

Female Poverty Among 25-34 Year Olds Correlation Summary

MeasurementScottishAssyrian/Chaldean/Syriac
Minimum3.2%0.92%
Maximum100.0%23.2%
Range96.8%22.3%
Mean33.8%10.3%
Median19.7%10.1%
Interquartile 25% (IQ1)15.4%6.8%
Interquartile 75% (IQ3)45.2%13.3%
Interquartile Range (IQR)29.9%6.5%
Standard Deviation (Sample)27.8%4.7%
Standard Deviation (Population)27.6%4.7%

Similar Demographics by Female Poverty Among 25-34 Year Olds

Demographics Similar to Scottish by Female Poverty Among 25-34 Year Olds

In terms of female poverty among 25-34 year olds, the demographic groups most similar to Scottish are Immigrants from Cambodia (13.9%, a difference of 0.050%), Moroccan (13.8%, a difference of 0.16%), Immigrants from Saudi Arabia (13.9%, a difference of 0.20%), Immigrants from Germany (13.9%, a difference of 0.32%), and English (13.9%, a difference of 0.38%).
DemographicsRating | RankFemale Poverty Among 25-34 Year Olds
Finns
32.5
/100
|
#189
Fair
13.7%
Dutch
29.7
/100
|
#190
Fair
13.8%
Immigrants | St. Vincent and the Grenadines
29.3
/100
|
#191
Fair
13.8%
Tlingit-Haida
28.1
/100
|
#192
Fair
13.8%
Immigrants | Kenya
28.0
/100
|
#193
Fair
13.8%
Moroccans
25.1
/100
|
#194
Fair
13.8%
Immigrants | Cambodia
24.0
/100
|
#195
Fair
13.9%
Scottish
23.6
/100
|
#196
Fair
13.9%
Immigrants | Saudi Arabia
21.9
/100
|
#197
Fair
13.9%
Immigrants | Germany
20.9
/100
|
#198
Fair
13.9%
English
20.4
/100
|
#199
Fair
13.9%
Hmong
20.3
/100
|
#200
Fair
13.9%
Immigrants | Trinidad and Tobago
17.6
/100
|
#201
Poor
14.0%
Welsh
17.2
/100
|
#202
Poor
14.0%
Immigrants | Immigrants
14.5
/100
|
#203
Poor
14.0%

Demographics Similar to Assyrians/Chaldeans/Syriacs by Female Poverty Among 25-34 Year Olds

In terms of female poverty among 25-34 year olds, the demographic groups most similar to Assyrians/Chaldeans/Syriacs are Immigrants from Bolivia (11.2%, a difference of 0.040%), Burmese (11.2%, a difference of 0.11%), Indian (Asian) (11.2%, a difference of 0.11%), Immigrants from China (11.2%, a difference of 0.11%), and Immigrants from Ireland (11.2%, a difference of 0.22%).
DemographicsRating | RankFemale Poverty Among 25-34 Year Olds
Immigrants | Iran
100.0
/100
|
#8
Exceptional
11.0%
Immigrants | Singapore
100.0
/100
|
#9
Exceptional
11.1%
Immigrants | Lithuania
100.0
/100
|
#10
Exceptional
11.1%
Immigrants | Korea
100.0
/100
|
#11
Exceptional
11.1%
Immigrants | Ireland
100.0
/100
|
#12
Exceptional
11.2%
Burmese
100.0
/100
|
#13
Exceptional
11.2%
Indians (Asian)
100.0
/100
|
#14
Exceptional
11.2%
Assyrians/Chaldeans/Syriacs
100.0
/100
|
#15
Exceptional
11.2%
Immigrants | Bolivia
100.0
/100
|
#16
Exceptional
11.2%
Immigrants | China
100.0
/100
|
#17
Exceptional
11.2%
Immigrants | Eastern Asia
100.0
/100
|
#18
Exceptional
11.2%
Iranians
100.0
/100
|
#19
Exceptional
11.2%
Okinawans
100.0
/100
|
#20
Exceptional
11.3%
Turks
100.0
/100
|
#21
Exceptional
11.4%
Asians
99.9
/100
|
#22
Exceptional
11.4%