Scottish vs Ethiopian 11th Grade
COMPARE
Scottish
Ethiopian
11th Grade
11th Grade Comparison
Scottish
Ethiopians
94.4%
11TH GRADE
100.0/ 100
METRIC RATING
26th/ 347
METRIC RANK
92.2%
11TH GRADE
18.8/ 100
METRIC RATING
210th/ 347
METRIC RANK
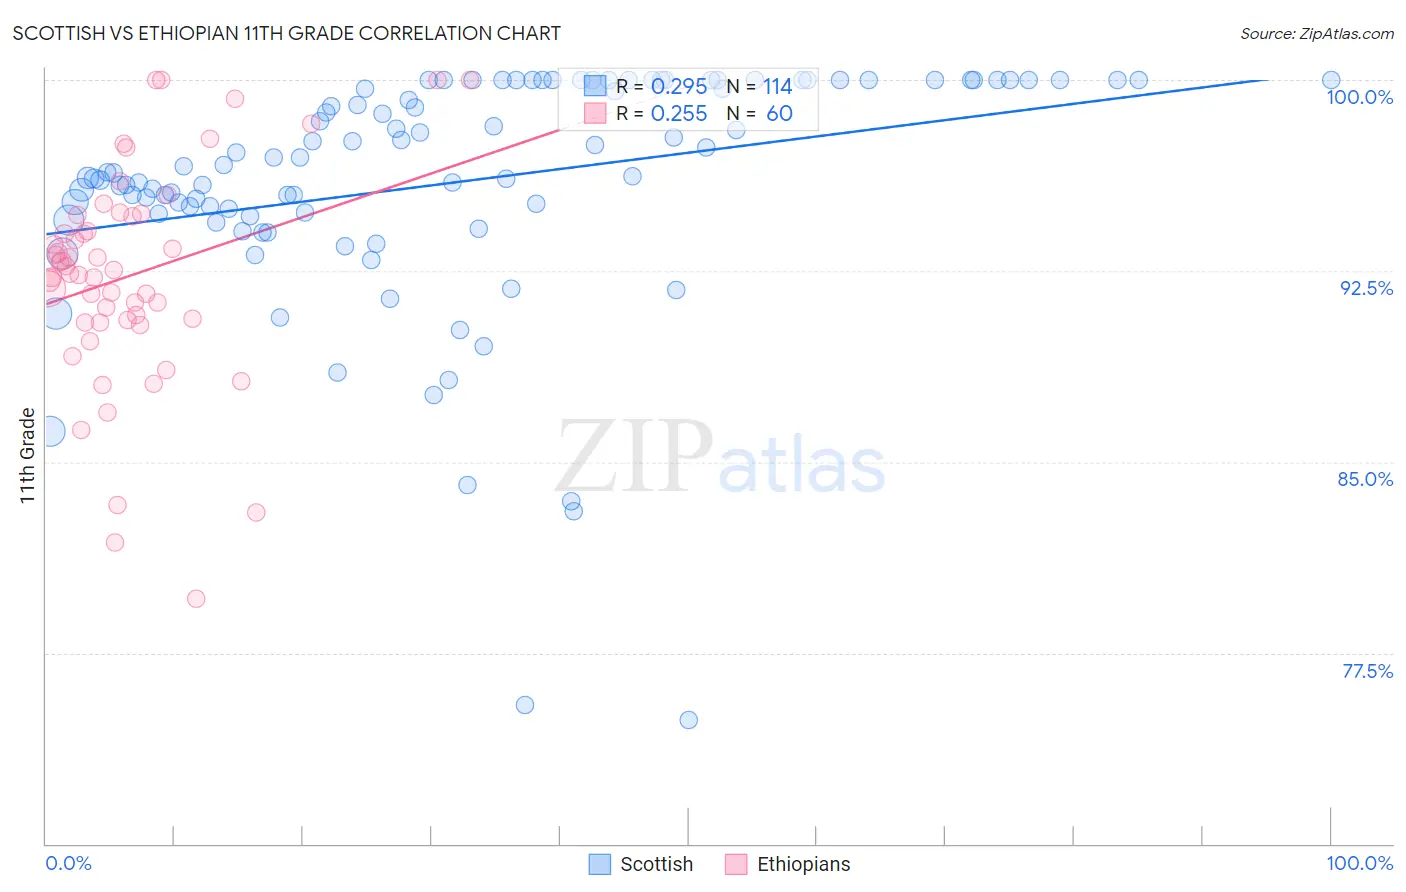
Scottish vs Ethiopian 11th Grade Correlation Chart
The statistical analysis conducted on geographies consisting of 567,140,505 people shows a weak positive correlation between the proportion of Scottish and percentage of population with at least 11th grade education in the United States with a correlation coefficient (R) of 0.295 and weighted average of 94.4%. Similarly, the statistical analysis conducted on geographies consisting of 223,161,778 people shows a weak positive correlation between the proportion of Ethiopians and percentage of population with at least 11th grade education in the United States with a correlation coefficient (R) of 0.255 and weighted average of 92.2%, a difference of 2.4%.
11th Grade Correlation Summary
| Measurement | Scottish | Ethiopian |
| Minimum | 74.9% | 79.6% |
| Maximum | 100.0% | 100.0% |
| Range | 25.1% | 20.4% |
| Mean | 96.0% | 92.3% |
| Median | 96.5% | 92.5% |
| Interquartile 25% (IQ1) | 94.7% | 90.5% |
| Interquartile 75% (IQ3) | 100.0% | 94.7% |
| Interquartile Range (IQR) | 5.3% | 4.1% |
| Standard Deviation (Sample) | 4.7% | 4.3% |
| Standard Deviation (Population) | 4.7% | 4.3% |
Similar Demographics by 11th Grade
Demographics Similar to Scottish by 11th Grade
In terms of 11th grade, the demographic groups most similar to Scottish are Irish (94.4%, a difference of 0.0%), English (94.4%, a difference of 0.020%), European (94.4%, a difference of 0.020%), Estonian (94.4%, a difference of 0.030%), and Tsimshian (94.4%, a difference of 0.050%).
| Demographics | Rating | Rank | 11th Grade |
| Scandinavians | 100.0 /100 | #19 | Exceptional 94.5% |
| Italians | 100.0 /100 | #20 | Exceptional 94.5% |
| Tlingit-Haida | 100.0 /100 | #21 | Exceptional 94.4% |
| Tsimshian | 100.0 /100 | #22 | Exceptional 94.4% |
| Czechs | 100.0 /100 | #23 | Exceptional 94.4% |
| English | 100.0 /100 | #24 | Exceptional 94.4% |
| Irish | 100.0 /100 | #25 | Exceptional 94.4% |
| Scottish | 100.0 /100 | #26 | Exceptional 94.4% |
| Europeans | 100.0 /100 | #27 | Exceptional 94.4% |
| Estonians | 100.0 /100 | #28 | Exceptional 94.4% |
| Dutch | 100.0 /100 | #29 | Exceptional 94.3% |
| Russians | 100.0 /100 | #30 | Exceptional 94.3% |
| Welsh | 99.9 /100 | #31 | Exceptional 94.2% |
| Belgians | 99.9 /100 | #32 | Exceptional 94.2% |
| British | 99.9 /100 | #33 | Exceptional 94.2% |
Demographics Similar to Ethiopians by 11th Grade
In terms of 11th grade, the demographic groups most similar to Ethiopians are Tongan (92.2%, a difference of 0.010%), Immigrants from Micronesia (92.2%, a difference of 0.020%), Colville (92.2%, a difference of 0.040%), Immigrants from Oceania (92.2%, a difference of 0.050%), and Immigrants from Sudan (92.3%, a difference of 0.070%).
| Demographics | Rating | Rank | 11th Grade |
| Immigrants | Sudan | 23.5 /100 | #203 | Fair 92.3% |
| Immigrants | Hong Kong | 23.3 /100 | #204 | Fair 92.2% |
| Kiowa | 23.2 /100 | #205 | Fair 92.2% |
| Bolivians | 23.2 /100 | #206 | Fair 92.2% |
| Immigrants | Oceania | 22.4 /100 | #207 | Fair 92.2% |
| Colville | 21.8 /100 | #208 | Fair 92.2% |
| Tongans | 19.8 /100 | #209 | Poor 92.2% |
| Ethiopians | 18.8 /100 | #210 | Poor 92.2% |
| Immigrants | Micronesia | 17.7 /100 | #211 | Poor 92.2% |
| Koreans | 14.4 /100 | #212 | Poor 92.1% |
| Immigrants | Ethiopia | 13.9 /100 | #213 | Poor 92.1% |
| Afghans | 12.8 /100 | #214 | Poor 92.1% |
| Immigrants | Southern Europe | 12.5 /100 | #215 | Poor 92.1% |
| Somalis | 11.6 /100 | #216 | Poor 92.1% |
| Immigrants | Sierra Leone | 11.1 /100 | #217 | Poor 92.0% |