Scottish vs Cypriot Divorced or Separated
COMPARE
Scottish
Cypriot
Divorced or Separated
Divorced or Separated Comparison
Scottish
Cypriots
12.6%
DIVORCED OR SEPARATED
0.4/ 100
METRIC RATING
267th/ 347
METRIC RANK
10.5%
DIVORCED OR SEPARATED
100.0/ 100
METRIC RATING
13th/ 347
METRIC RANK
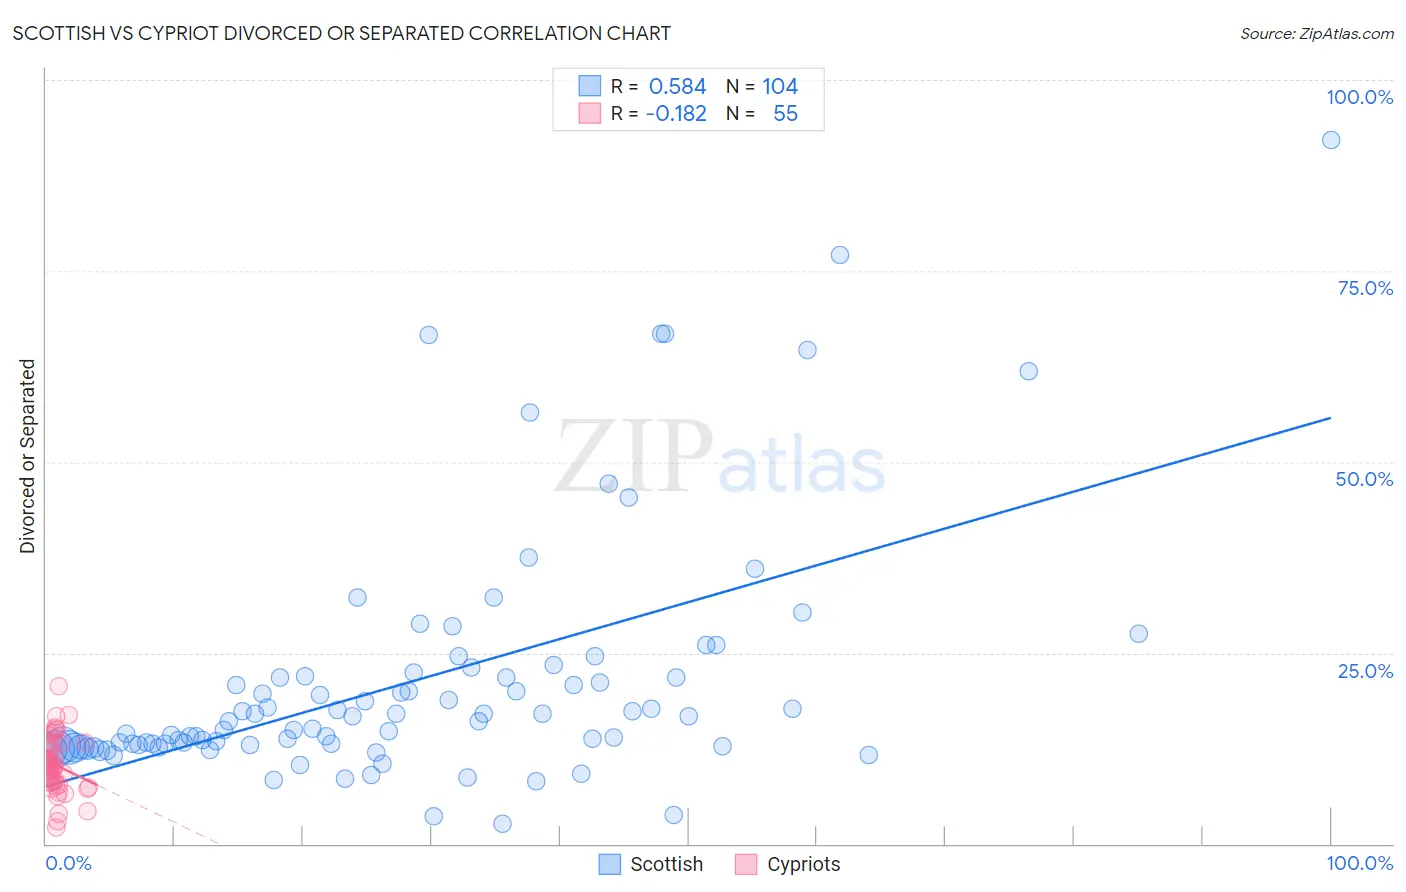
Scottish vs Cypriot Divorced or Separated Correlation Chart
The statistical analysis conducted on geographies consisting of 566,665,399 people shows a substantial positive correlation between the proportion of Scottish and percentage of population currently divorced or separated in the United States with a correlation coefficient (R) of 0.584 and weighted average of 12.6%. Similarly, the statistical analysis conducted on geographies consisting of 61,840,758 people shows a poor negative correlation between the proportion of Cypriots and percentage of population currently divorced or separated in the United States with a correlation coefficient (R) of -0.182 and weighted average of 10.5%, a difference of 20.4%.
Divorced or Separated Correlation Summary
| Measurement | Scottish | Cypriot |
| Minimum | 2.6% | 2.1% |
| Maximum | 92.2% | 20.6% |
| Range | 89.6% | 18.5% |
| Mean | 21.2% | 10.3% |
| Median | 16.0% | 10.3% |
| Interquartile 25% (IQ1) | 12.8% | 8.0% |
| Interquartile 75% (IQ3) | 21.8% | 12.7% |
| Interquartile Range (IQR) | 9.1% | 4.7% |
| Standard Deviation (Sample) | 16.0% | 3.5% |
| Standard Deviation (Population) | 15.9% | 3.5% |
Similar Demographics by Divorced or Separated
Demographics Similar to Scottish by Divorced or Separated
In terms of divorced or separated, the demographic groups most similar to Scottish are Fijian (12.6%, a difference of 0.010%), Immigrants from Liberia (12.6%, a difference of 0.030%), White/Caucasian (12.6%, a difference of 0.040%), Immigrants from Senegal (12.6%, a difference of 0.050%), and English (12.6%, a difference of 0.070%).
| Demographics | Rating | Rank | Divorced or Separated |
| Immigrants | Uruguay | 0.6 /100 | #260 | Tragic 12.6% |
| Immigrants | Dominica | 0.5 /100 | #261 | Tragic 12.6% |
| Basques | 0.5 /100 | #262 | Tragic 12.6% |
| Immigrants | Panama | 0.5 /100 | #263 | Tragic 12.6% |
| English | 0.5 /100 | #264 | Tragic 12.6% |
| Immigrants | Senegal | 0.5 /100 | #265 | Tragic 12.6% |
| Whites/Caucasians | 0.5 /100 | #266 | Tragic 12.6% |
| Scottish | 0.4 /100 | #267 | Tragic 12.6% |
| Fijians | 0.4 /100 | #268 | Tragic 12.6% |
| Immigrants | Liberia | 0.4 /100 | #269 | Tragic 12.6% |
| Ute | 0.4 /100 | #270 | Tragic 12.6% |
| Panamanians | 0.3 /100 | #271 | Tragic 12.7% |
| Immigrants | Middle Africa | 0.3 /100 | #272 | Tragic 12.7% |
| Immigrants | Micronesia | 0.3 /100 | #273 | Tragic 12.7% |
| Bermudans | 0.3 /100 | #274 | Tragic 12.7% |
Demographics Similar to Cypriots by Divorced or Separated
In terms of divorced or separated, the demographic groups most similar to Cypriots are Okinawan (10.5%, a difference of 0.16%), Immigrants from South Central Asia (10.4%, a difference of 0.49%), Assyrian/Chaldean/Syriac (10.6%, a difference of 0.74%), Immigrants from Armenia (10.6%, a difference of 0.81%), and Immigrants from Korea (10.6%, a difference of 1.3%).
| Demographics | Rating | Rank | Divorced or Separated |
| Indians (Asian) | 100.0 /100 | #6 | Exceptional 10.2% |
| Thais | 100.0 /100 | #7 | Exceptional 10.2% |
| Immigrants | Eastern Asia | 100.0 /100 | #8 | Exceptional 10.2% |
| Yup'ik | 100.0 /100 | #9 | Exceptional 10.3% |
| Immigrants | Singapore | 100.0 /100 | #10 | Exceptional 10.3% |
| Immigrants | South Central Asia | 100.0 /100 | #11 | Exceptional 10.4% |
| Okinawans | 100.0 /100 | #12 | Exceptional 10.5% |
| Cypriots | 100.0 /100 | #13 | Exceptional 10.5% |
| Assyrians/Chaldeans/Syriacs | 100.0 /100 | #14 | Exceptional 10.6% |
| Immigrants | Armenia | 100.0 /100 | #15 | Exceptional 10.6% |
| Immigrants | Korea | 100.0 /100 | #16 | Exceptional 10.6% |
| Immigrants | Israel | 100.0 /100 | #17 | Exceptional 10.6% |
| Immigrants | Iran | 100.0 /100 | #18 | Exceptional 10.6% |
| Asians | 100.0 /100 | #19 | Exceptional 10.6% |
| Burmese | 100.0 /100 | #20 | Exceptional 10.7% |