Scotch-Irish vs Aleut Child Poverty Under the Age of 5
COMPARE
Scotch-Irish
Aleut
Child Poverty Under the Age of 5
Child Poverty Under the Age of 5 Comparison
Scotch-Irish
Aleuts
18.2%
CHILD POVERTY UNDER THE AGE OF 5
9.8/ 100
METRIC RATING
208th/ 347
METRIC RANK
20.3%
CHILD POVERTY UNDER THE AGE OF 5
0.1/ 100
METRIC RATING
266th/ 347
METRIC RANK
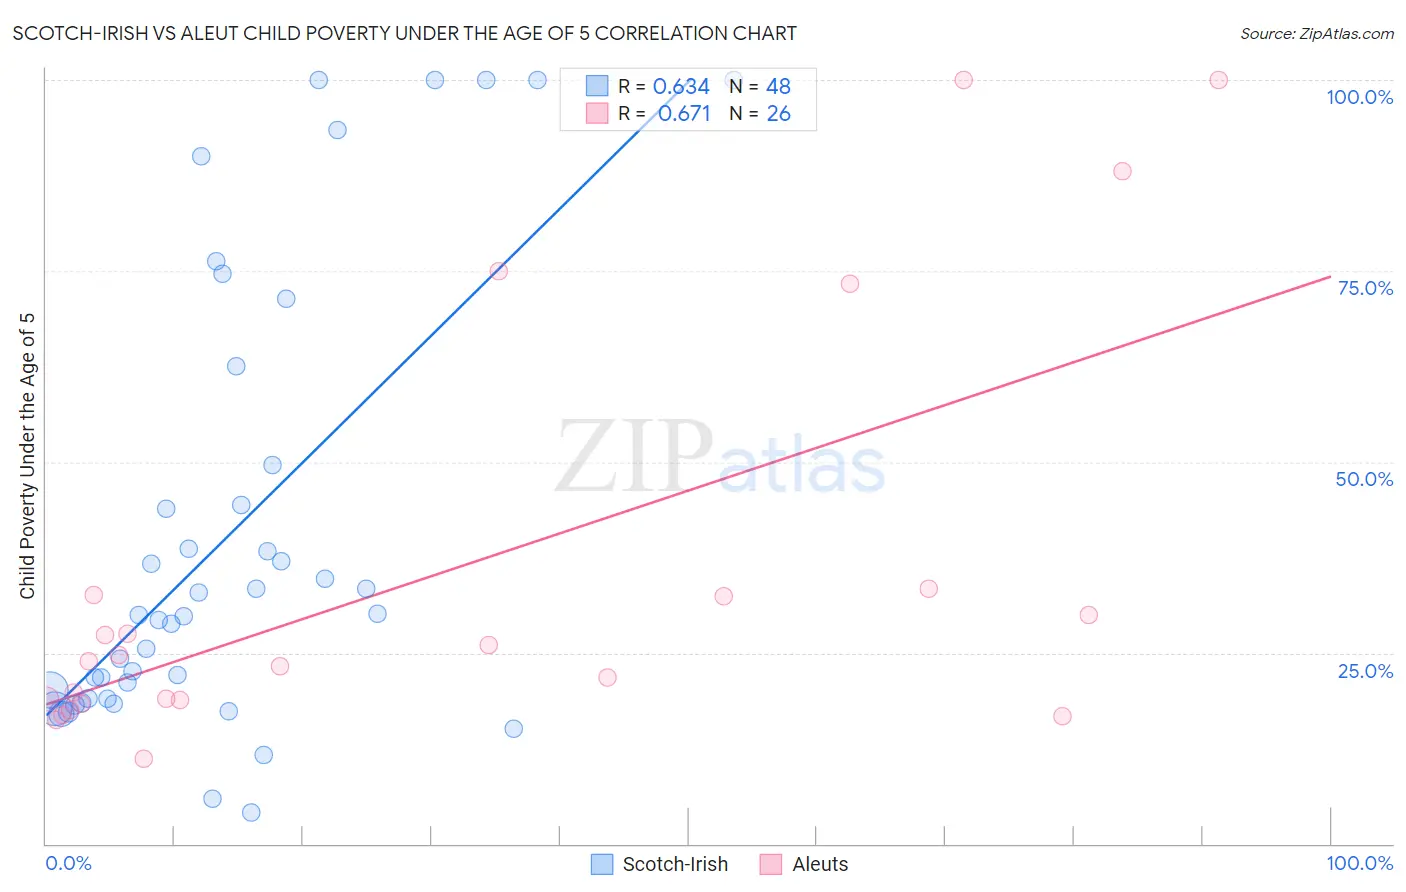
Scotch-Irish vs Aleut Child Poverty Under the Age of 5 Correlation Chart
The statistical analysis conducted on geographies consisting of 512,287,895 people shows a significant positive correlation between the proportion of Scotch-Irish and poverty level among children under the age of 5 in the United States with a correlation coefficient (R) of 0.634 and weighted average of 18.2%. Similarly, the statistical analysis conducted on geographies consisting of 61,069,429 people shows a significant positive correlation between the proportion of Aleuts and poverty level among children under the age of 5 in the United States with a correlation coefficient (R) of 0.671 and weighted average of 20.3%, a difference of 11.2%.
Child Poverty Under the Age of 5 Correlation Summary
| Measurement | Scotch-Irish | Aleut |
| Minimum | 4.1% | 11.1% |
| Maximum | 100.0% | 100.0% |
| Range | 95.9% | 88.9% |
| Mean | 39.9% | 35.1% |
| Median | 29.9% | 24.3% |
| Interquartile 25% (IQ1) | 19.0% | 18.8% |
| Interquartile 75% (IQ3) | 47.0% | 32.6% |
| Interquartile Range (IQR) | 28.1% | 13.9% |
| Standard Deviation (Sample) | 28.8% | 27.1% |
| Standard Deviation (Population) | 28.5% | 26.5% |
Similar Demographics by Child Poverty Under the Age of 5
Demographics Similar to Scotch-Irish by Child Poverty Under the Age of 5
In terms of child poverty under the age of 5, the demographic groups most similar to Scotch-Irish are Spanish (18.2%, a difference of 0.010%), Immigrants (18.2%, a difference of 0.020%), Panamanian (18.2%, a difference of 0.020%), Moroccan (18.2%, a difference of 0.11%), and Nepalese (18.3%, a difference of 0.32%).
| Demographics | Rating | Rank | Child Poverty Under the Age of 5 |
| Ugandans | 13.9 /100 | #201 | Poor 18.0% |
| Japanese | 13.8 /100 | #202 | Poor 18.1% |
| Immigrants | Cambodia | 13.7 /100 | #203 | Poor 18.1% |
| Immigrants | Eastern Africa | 13.4 /100 | #204 | Poor 18.1% |
| Spaniards | 12.8 /100 | #205 | Poor 18.1% |
| Whites/Caucasians | 12.6 /100 | #206 | Poor 18.1% |
| Immigrants | Immigrants | 9.9 /100 | #207 | Tragic 18.2% |
| Scotch-Irish | 9.8 /100 | #208 | Tragic 18.2% |
| Spanish | 9.8 /100 | #209 | Tragic 18.2% |
| Panamanians | 9.7 /100 | #210 | Tragic 18.2% |
| Moroccans | 9.4 /100 | #211 | Tragic 18.2% |
| Nepalese | 8.7 /100 | #212 | Tragic 18.3% |
| Immigrants | Thailand | 8.6 /100 | #213 | Tragic 18.3% |
| Malaysians | 6.5 /100 | #214 | Tragic 18.4% |
| Immigrants | Panama | 6.0 /100 | #215 | Tragic 18.5% |
Demographics Similar to Aleuts by Child Poverty Under the Age of 5
In terms of child poverty under the age of 5, the demographic groups most similar to Aleuts are Spanish American Indian (20.2%, a difference of 0.13%), Immigrants from Liberia (20.2%, a difference of 0.24%), Barbadian (20.2%, a difference of 0.37%), Ottawa (20.3%, a difference of 0.39%), and Belizean (20.3%, a difference of 0.40%).
| Demographics | Rating | Rank | Child Poverty Under the Age of 5 |
| Immigrants | El Salvador | 0.2 /100 | #259 | Tragic 20.0% |
| Spanish Americans | 0.2 /100 | #260 | Tragic 20.1% |
| Immigrants | Bangladesh | 0.2 /100 | #261 | Tragic 20.1% |
| Liberians | 0.1 /100 | #262 | Tragic 20.2% |
| Barbadians | 0.1 /100 | #263 | Tragic 20.2% |
| Immigrants | Liberia | 0.1 /100 | #264 | Tragic 20.2% |
| Spanish American Indians | 0.1 /100 | #265 | Tragic 20.2% |
| Aleuts | 0.1 /100 | #266 | Tragic 20.3% |
| Ottawa | 0.1 /100 | #267 | Tragic 20.3% |
| Belizeans | 0.1 /100 | #268 | Tragic 20.3% |
| Immigrants | Burma/Myanmar | 0.1 /100 | #269 | Tragic 20.4% |
| Jamaicans | 0.1 /100 | #270 | Tragic 20.4% |
| Americans | 0.1 /100 | #271 | Tragic 20.5% |
| Immigrants | Jamaica | 0.1 /100 | #272 | Tragic 20.5% |
| Central Americans | 0.1 /100 | #273 | Tragic 20.6% |