Scotch-Irish vs Native/Alaskan Seniors Poverty Over the Age of 65
COMPARE
Scotch-Irish
Native/Alaskan
Seniors Poverty Over the Age of 65
Seniors Poverty Over the Age of 65 Comparison
Scotch-Irish
Natives/Alaskans
9.5%
SENIORS POVERTY OVER THE AGE OF 65
99.7/ 100
METRIC RATING
37th/ 347
METRIC RANK
14.2%
SENIORS POVERTY OVER THE AGE OF 65
0.0/ 100
METRIC RATING
311th/ 347
METRIC RANK
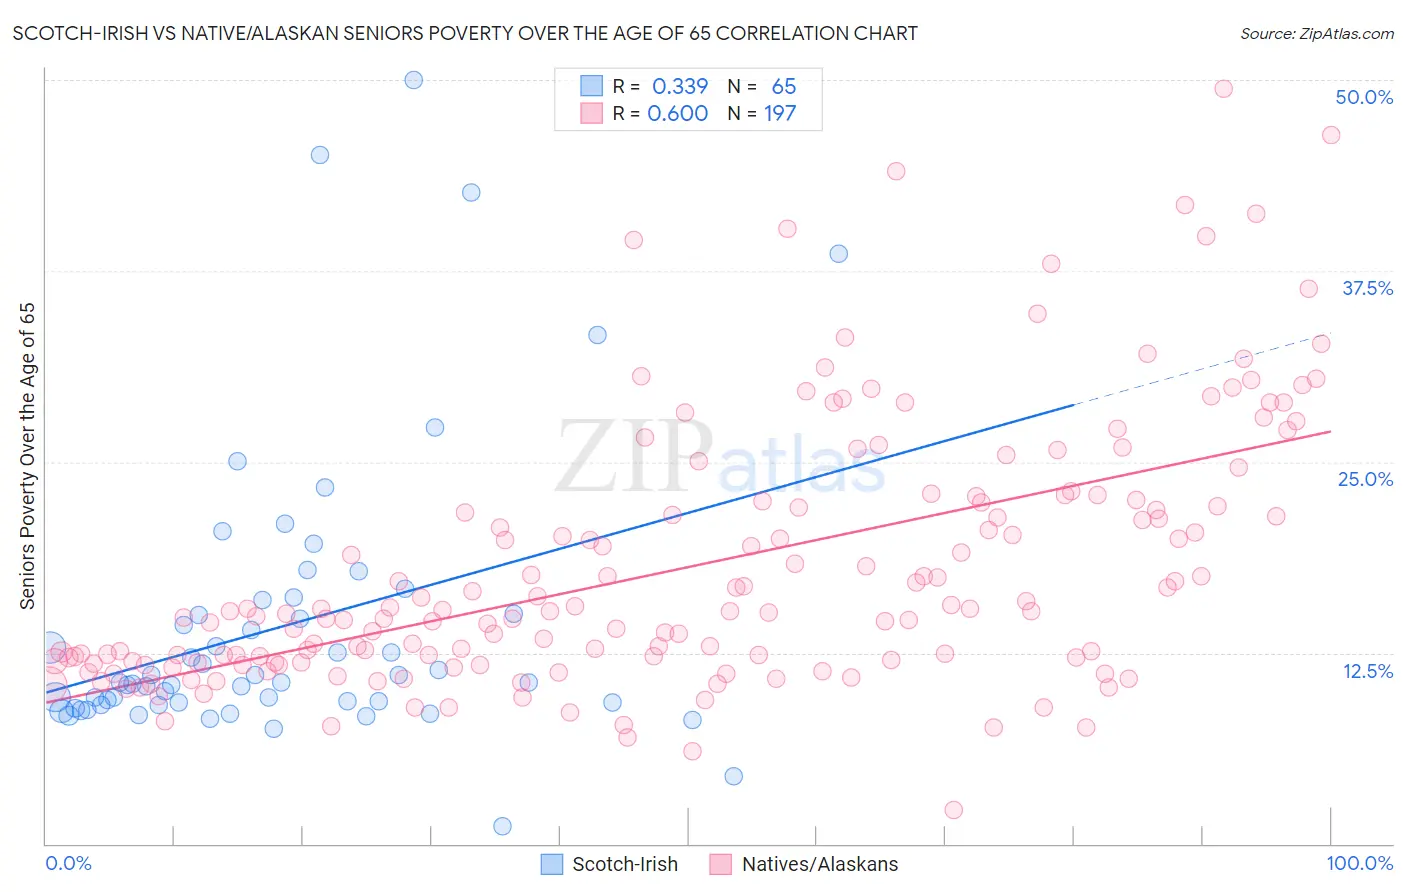
Scotch-Irish vs Native/Alaskan Seniors Poverty Over the Age of 65 Correlation Chart
The statistical analysis conducted on geographies consisting of 544,466,236 people shows a mild positive correlation between the proportion of Scotch-Irish and poverty level among seniors over the age of 65 in the United States with a correlation coefficient (R) of 0.339 and weighted average of 9.5%. Similarly, the statistical analysis conducted on geographies consisting of 510,101,075 people shows a substantial positive correlation between the proportion of Natives/Alaskans and poverty level among seniors over the age of 65 in the United States with a correlation coefficient (R) of 0.600 and weighted average of 14.2%, a difference of 49.8%.
Seniors Poverty Over the Age of 65 Correlation Summary
| Measurement | Scotch-Irish | Native/Alaskan |
| Minimum | 1.1% | 2.2% |
| Maximum | 50.0% | 49.4% |
| Range | 48.9% | 47.2% |
| Mean | 14.3% | 18.1% |
| Median | 10.5% | 15.2% |
| Interquartile 25% (IQ1) | 9.2% | 11.9% |
| Interquartile 75% (IQ3) | 15.5% | 22.3% |
| Interquartile Range (IQR) | 6.3% | 10.4% |
| Standard Deviation (Sample) | 9.4% | 8.6% |
| Standard Deviation (Population) | 9.3% | 8.6% |
Similar Demographics by Seniors Poverty Over the Age of 65
Demographics Similar to Scotch-Irish by Seniors Poverty Over the Age of 65
In terms of seniors poverty over the age of 65, the demographic groups most similar to Scotch-Irish are Belgian (9.5%, a difference of 0.020%), Czechoslovakian (9.5%, a difference of 0.50%), Latvian (9.5%, a difference of 0.55%), Greek (9.6%, a difference of 0.65%), and Assyrian/Chaldean/Syriac (9.6%, a difference of 0.77%).
| Demographics | Rating | Rank | Seniors Poverty Over the Age of 65 |
| Menominee | 99.8 /100 | #30 | Exceptional 9.4% |
| Finns | 99.8 /100 | #31 | Exceptional 9.4% |
| Northern Europeans | 99.8 /100 | #32 | Exceptional 9.4% |
| Native Hawaiians | 99.8 /100 | #33 | Exceptional 9.4% |
| British | 99.8 /100 | #34 | Exceptional 9.4% |
| Latvians | 99.8 /100 | #35 | Exceptional 9.5% |
| Czechoslovakians | 99.8 /100 | #36 | Exceptional 9.5% |
| Scotch-Irish | 99.7 /100 | #37 | Exceptional 9.5% |
| Belgians | 99.7 /100 | #38 | Exceptional 9.5% |
| Greeks | 99.6 /100 | #39 | Exceptional 9.6% |
| Assyrians/Chaldeans/Syriacs | 99.6 /100 | #40 | Exceptional 9.6% |
| Immigrants | North Macedonia | 99.6 /100 | #41 | Exceptional 9.6% |
| Zimbabweans | 99.6 /100 | #42 | Exceptional 9.6% |
| Eastern Europeans | 99.6 /100 | #43 | Exceptional 9.6% |
| Austrians | 99.5 /100 | #44 | Exceptional 9.6% |
Demographics Similar to Natives/Alaskans by Seniors Poverty Over the Age of 65
In terms of seniors poverty over the age of 65, the demographic groups most similar to Natives/Alaskans are Bahamian (14.2%, a difference of 0.010%), Honduran (14.2%, a difference of 0.27%), Trinidadian and Tobagonian (14.2%, a difference of 0.36%), Immigrants from West Indies (14.2%, a difference of 0.44%), and Hispanic or Latino (14.3%, a difference of 0.54%).
| Demographics | Rating | Rank | Seniors Poverty Over the Age of 65 |
| West Indians | 0.0 /100 | #304 | Tragic 14.1% |
| Immigrants | Trinidad and Tobago | 0.0 /100 | #305 | Tragic 14.1% |
| Immigrants | Latin America | 0.0 /100 | #306 | Tragic 14.2% |
| Immigrants | West Indies | 0.0 /100 | #307 | Tragic 14.2% |
| Trinidadians and Tobagonians | 0.0 /100 | #308 | Tragic 14.2% |
| Hondurans | 0.0 /100 | #309 | Tragic 14.2% |
| Bahamians | 0.0 /100 | #310 | Tragic 14.2% |
| Natives/Alaskans | 0.0 /100 | #311 | Tragic 14.2% |
| Hispanics or Latinos | 0.0 /100 | #312 | Tragic 14.3% |
| Barbadians | 0.0 /100 | #313 | Tragic 14.4% |
| Guyanese | 0.0 /100 | #314 | Tragic 14.4% |
| Immigrants | Ecuador | 0.0 /100 | #315 | Tragic 14.4% |
| Immigrants | Guyana | 0.0 /100 | #316 | Tragic 14.5% |
| Haitians | 0.0 /100 | #317 | Tragic 14.5% |
| Immigrants | Honduras | 0.0 /100 | #318 | Tragic 14.5% |