Scotch-Irish vs Immigrants from Turkey Seniors Poverty Over the Age of 65
COMPARE
Scotch-Irish
Immigrants from Turkey
Seniors Poverty Over the Age of 65
Seniors Poverty Over the Age of 65 Comparison
Scotch-Irish
Immigrants from Turkey
9.5%
SENIORS POVERTY OVER THE AGE OF 65
99.7/ 100
METRIC RATING
37th/ 347
METRIC RANK
10.5%
SENIORS POVERTY OVER THE AGE OF 65
87.7/ 100
METRIC RATING
132nd/ 347
METRIC RANK
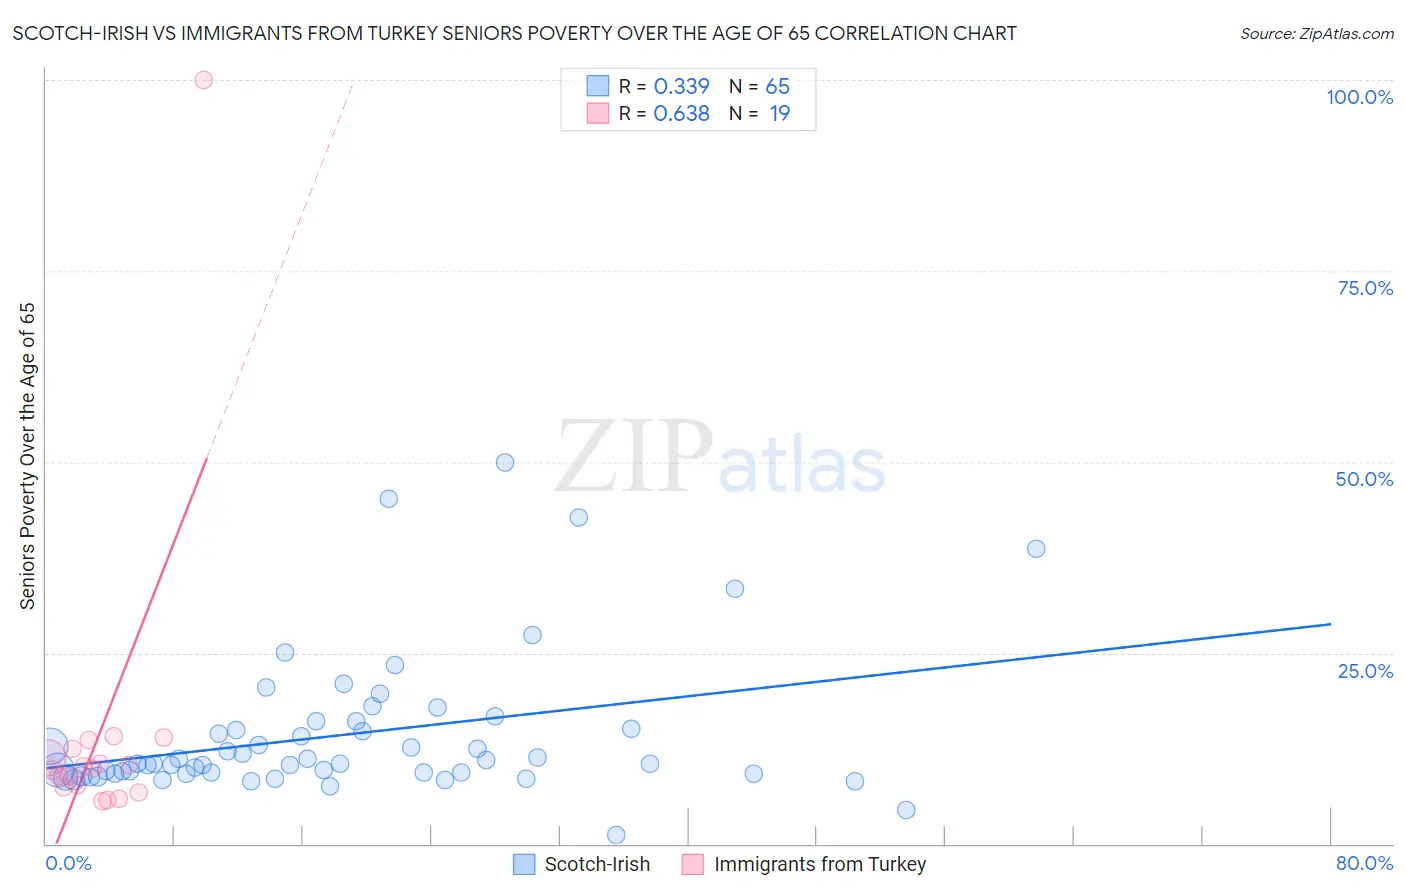
Scotch-Irish vs Immigrants from Turkey Seniors Poverty Over the Age of 65 Correlation Chart
The statistical analysis conducted on geographies consisting of 544,466,236 people shows a mild positive correlation between the proportion of Scotch-Irish and poverty level among seniors over the age of 65 in the United States with a correlation coefficient (R) of 0.339 and weighted average of 9.5%. Similarly, the statistical analysis conducted on geographies consisting of 222,593,467 people shows a significant positive correlation between the proportion of Immigrants from Turkey and poverty level among seniors over the age of 65 in the United States with a correlation coefficient (R) of 0.638 and weighted average of 10.5%, a difference of 10.0%.
Seniors Poverty Over the Age of 65 Correlation Summary
| Measurement | Scotch-Irish | Immigrants from Turkey |
| Minimum | 1.1% | 5.6% |
| Maximum | 50.0% | 100.0% |
| Range | 48.9% | 94.4% |
| Mean | 14.3% | 14.3% |
| Median | 10.5% | 9.8% |
| Interquartile 25% (IQ1) | 9.2% | 7.3% |
| Interquartile 75% (IQ3) | 15.5% | 12.5% |
| Interquartile Range (IQR) | 6.3% | 5.2% |
| Standard Deviation (Sample) | 9.4% | 20.9% |
| Standard Deviation (Population) | 9.3% | 20.4% |
Similar Demographics by Seniors Poverty Over the Age of 65
Demographics Similar to Scotch-Irish by Seniors Poverty Over the Age of 65
In terms of seniors poverty over the age of 65, the demographic groups most similar to Scotch-Irish are Belgian (9.5%, a difference of 0.020%), Czechoslovakian (9.5%, a difference of 0.50%), Latvian (9.5%, a difference of 0.55%), Greek (9.6%, a difference of 0.65%), and Assyrian/Chaldean/Syriac (9.6%, a difference of 0.77%).
| Demographics | Rating | Rank | Seniors Poverty Over the Age of 65 |
| Menominee | 99.8 /100 | #30 | Exceptional 9.4% |
| Finns | 99.8 /100 | #31 | Exceptional 9.4% |
| Northern Europeans | 99.8 /100 | #32 | Exceptional 9.4% |
| Native Hawaiians | 99.8 /100 | #33 | Exceptional 9.4% |
| British | 99.8 /100 | #34 | Exceptional 9.4% |
| Latvians | 99.8 /100 | #35 | Exceptional 9.5% |
| Czechoslovakians | 99.8 /100 | #36 | Exceptional 9.5% |
| Scotch-Irish | 99.7 /100 | #37 | Exceptional 9.5% |
| Belgians | 99.7 /100 | #38 | Exceptional 9.5% |
| Greeks | 99.6 /100 | #39 | Exceptional 9.6% |
| Assyrians/Chaldeans/Syriacs | 99.6 /100 | #40 | Exceptional 9.6% |
| Immigrants | North Macedonia | 99.6 /100 | #41 | Exceptional 9.6% |
| Zimbabweans | 99.6 /100 | #42 | Exceptional 9.6% |
| Eastern Europeans | 99.6 /100 | #43 | Exceptional 9.6% |
| Austrians | 99.5 /100 | #44 | Exceptional 9.6% |
Demographics Similar to Immigrants from Turkey by Seniors Poverty Over the Age of 65
In terms of seniors poverty over the age of 65, the demographic groups most similar to Immigrants from Turkey are Egyptian (10.5%, a difference of 0.010%), Guamanian/Chamorro (10.5%, a difference of 0.040%), Immigrants from Oceania (10.4%, a difference of 0.16%), Immigrants from Iran (10.4%, a difference of 0.17%), and Ottawa (10.4%, a difference of 0.19%).
| Demographics | Rating | Rank | Seniors Poverty Over the Age of 65 |
| Immigrants | Philippines | 89.4 /100 | #125 | Excellent 10.4% |
| Immigrants | Hungary | 89.1 /100 | #126 | Excellent 10.4% |
| Cambodians | 89.1 /100 | #127 | Excellent 10.4% |
| Ottawa | 88.5 /100 | #128 | Excellent 10.4% |
| Immigrants | Iran | 88.4 /100 | #129 | Excellent 10.4% |
| Immigrants | Oceania | 88.4 /100 | #130 | Excellent 10.4% |
| Egyptians | 87.8 /100 | #131 | Excellent 10.5% |
| Immigrants | Turkey | 87.7 /100 | #132 | Excellent 10.5% |
| Guamanians/Chamorros | 87.5 /100 | #133 | Excellent 10.5% |
| Sierra Leoneans | 86.8 /100 | #134 | Excellent 10.5% |
| Immigrants | Norway | 86.5 /100 | #135 | Excellent 10.5% |
| Immigrants | Serbia | 86.4 /100 | #136 | Excellent 10.5% |
| Immigrants | Australia | 85.1 /100 | #137 | Excellent 10.5% |
| Immigrants | Latvia | 84.7 /100 | #138 | Excellent 10.5% |
| Portuguese | 84.1 /100 | #139 | Excellent 10.5% |