Immigrants from Nicaragua vs Okinawan Male Poverty
COMPARE
Immigrants from Nicaragua
Okinawan
Male Poverty
Male Poverty Comparison
Immigrants from Nicaragua
Okinawans
12.9%
MALE POVERTY
0.2/ 100
METRIC RATING
250th/ 347
METRIC RANK
10.7%
MALE POVERTY
87.6/ 100
METRIC RATING
118th/ 347
METRIC RANK
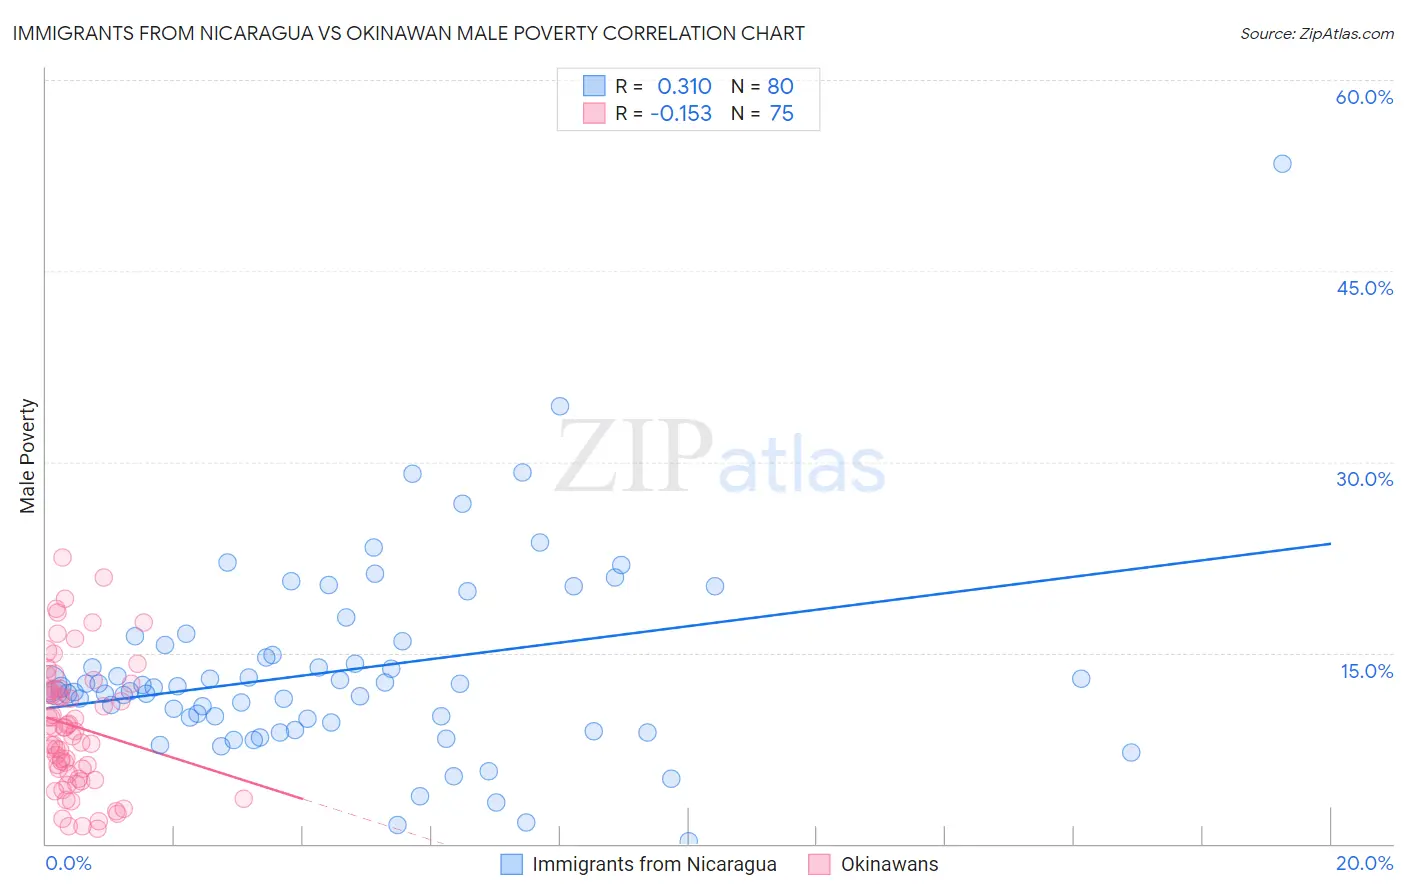
Immigrants from Nicaragua vs Okinawan Male Poverty Correlation Chart
The statistical analysis conducted on geographies consisting of 236,310,825 people shows a mild positive correlation between the proportion of Immigrants from Nicaragua and poverty level among males in the United States with a correlation coefficient (R) of 0.310 and weighted average of 12.9%. Similarly, the statistical analysis conducted on geographies consisting of 73,717,243 people shows a poor negative correlation between the proportion of Okinawans and poverty level among males in the United States with a correlation coefficient (R) of -0.153 and weighted average of 10.7%, a difference of 21.2%.
Male Poverty Correlation Summary
| Measurement | Immigrants from Nicaragua | Okinawan |
| Minimum | 0.19% | 1.2% |
| Maximum | 53.4% | 22.5% |
| Range | 53.2% | 21.3% |
| Mean | 13.6% | 9.2% |
| Median | 12.3% | 9.1% |
| Interquartile 25% (IQ1) | 9.7% | 5.5% |
| Interquartile 75% (IQ3) | 15.8% | 12.1% |
| Interquartile Range (IQR) | 6.1% | 6.6% |
| Standard Deviation (Sample) | 7.7% | 5.0% |
| Standard Deviation (Population) | 7.7% | 4.9% |
Similar Demographics by Male Poverty
Demographics Similar to Immigrants from Nicaragua by Male Poverty
In terms of male poverty, the demographic groups most similar to Immigrants from Nicaragua are Potawatomi (12.9%, a difference of 0.010%), Immigrants from Sudan (12.9%, a difference of 0.080%), Immigrants from Cuba (12.9%, a difference of 0.10%), Immigrants from Ecuador (12.9%, a difference of 0.13%), and Immigrants from Western Africa (12.9%, a difference of 0.14%).
| Demographics | Rating | Rank | Male Poverty |
| Alaskan Athabascans | 0.3 /100 | #243 | Tragic 12.8% |
| Tsimshian | 0.3 /100 | #244 | Tragic 12.8% |
| Liberians | 0.3 /100 | #245 | Tragic 12.8% |
| Immigrants | El Salvador | 0.2 /100 | #246 | Tragic 12.8% |
| Immigrants | Western Africa | 0.2 /100 | #247 | Tragic 12.9% |
| Immigrants | Sudan | 0.2 /100 | #248 | Tragic 12.9% |
| Potawatomi | 0.2 /100 | #249 | Tragic 12.9% |
| Immigrants | Nicaragua | 0.2 /100 | #250 | Tragic 12.9% |
| Immigrants | Cuba | 0.2 /100 | #251 | Tragic 12.9% |
| Immigrants | Ecuador | 0.2 /100 | #252 | Tragic 12.9% |
| Immigrants | Ghana | 0.2 /100 | #253 | Tragic 12.9% |
| Mexican American Indians | 0.1 /100 | #254 | Tragic 13.0% |
| Immigrants | Liberia | 0.1 /100 | #255 | Tragic 13.0% |
| Immigrants | Burma/Myanmar | 0.1 /100 | #256 | Tragic 13.0% |
| Immigrants | Trinidad and Tobago | 0.1 /100 | #257 | Tragic 13.1% |
Demographics Similar to Okinawans by Male Poverty
In terms of male poverty, the demographic groups most similar to Okinawans are Immigrants from Hungary (10.7%, a difference of 0.010%), Immigrants from South Eastern Asia (10.6%, a difference of 0.11%), Immigrants from China (10.7%, a difference of 0.11%), Sri Lankan (10.6%, a difference of 0.12%), and Peruvian (10.7%, a difference of 0.12%).
| Demographics | Rating | Rank | Male Poverty |
| Immigrants | Argentina | 89.8 /100 | #111 | Excellent 10.6% |
| Immigrants | Turkey | 89.5 /100 | #112 | Excellent 10.6% |
| Palestinians | 89.1 /100 | #113 | Excellent 10.6% |
| Immigrants | Brazil | 89.0 /100 | #114 | Excellent 10.6% |
| Immigrants | Russia | 88.6 /100 | #115 | Excellent 10.6% |
| Sri Lankans | 88.1 /100 | #116 | Excellent 10.6% |
| Immigrants | South Eastern Asia | 88.1 /100 | #117 | Excellent 10.6% |
| Okinawans | 87.6 /100 | #118 | Excellent 10.7% |
| Immigrants | Hungary | 87.6 /100 | #119 | Excellent 10.7% |
| Immigrants | China | 87.1 /100 | #120 | Excellent 10.7% |
| Peruvians | 87.1 /100 | #121 | Excellent 10.7% |
| Native Hawaiians | 87.0 /100 | #122 | Excellent 10.7% |
| South Africans | 86.8 /100 | #123 | Excellent 10.7% |
| French | 86.7 /100 | #124 | Excellent 10.7% |
| Immigrants | Norway | 86.0 /100 | #125 | Excellent 10.7% |