Immigrants from Korea vs Immigrants from Turkey Seniors Poverty Over the Age of 65
COMPARE
Immigrants from Korea
Immigrants from Turkey
Seniors Poverty Over the Age of 65
Seniors Poverty Over the Age of 65 Comparison
Immigrants from Korea
Immigrants from Turkey
10.3%
SENIORS POVERTY OVER THE AGE OF 65
93.3/ 100
METRIC RATING
112th/ 347
METRIC RANK
10.5%
SENIORS POVERTY OVER THE AGE OF 65
87.7/ 100
METRIC RATING
132nd/ 347
METRIC RANK
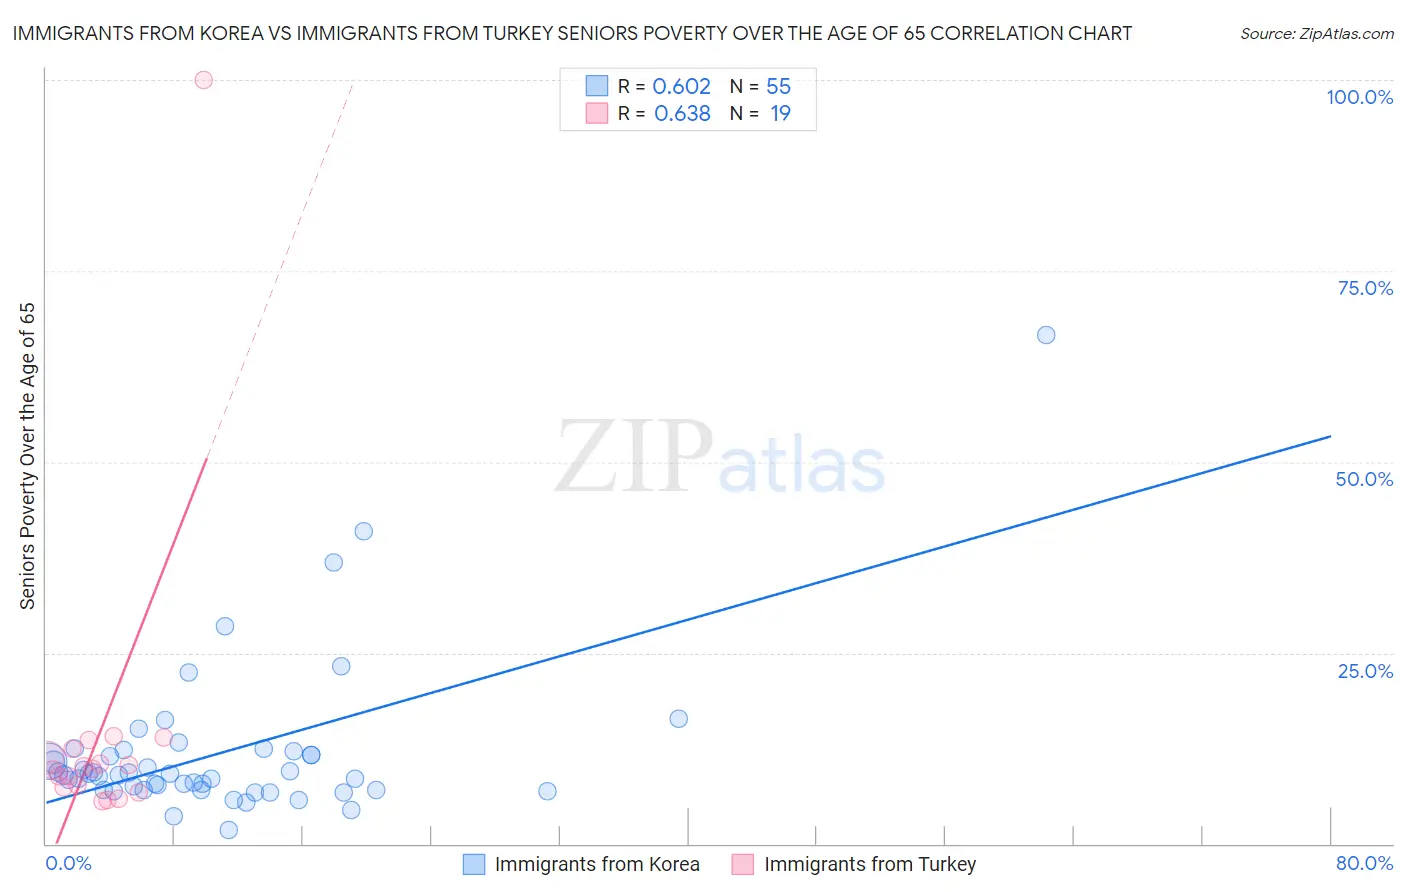
Immigrants from Korea vs Immigrants from Turkey Seniors Poverty Over the Age of 65 Correlation Chart
The statistical analysis conducted on geographies consisting of 414,371,248 people shows a significant positive correlation between the proportion of Immigrants from Korea and poverty level among seniors over the age of 65 in the United States with a correlation coefficient (R) of 0.602 and weighted average of 10.3%. Similarly, the statistical analysis conducted on geographies consisting of 222,593,467 people shows a significant positive correlation between the proportion of Immigrants from Turkey and poverty level among seniors over the age of 65 in the United States with a correlation coefficient (R) of 0.638 and weighted average of 10.5%, a difference of 1.6%.
Seniors Poverty Over the Age of 65 Correlation Summary
| Measurement | Immigrants from Korea | Immigrants from Turkey |
| Minimum | 1.8% | 5.6% |
| Maximum | 66.7% | 100.0% |
| Range | 64.8% | 94.4% |
| Mean | 11.9% | 14.3% |
| Median | 9.0% | 9.8% |
| Interquartile 25% (IQ1) | 7.1% | 7.3% |
| Interquartile 75% (IQ3) | 12.1% | 12.5% |
| Interquartile Range (IQR) | 5.1% | 5.2% |
| Standard Deviation (Sample) | 10.4% | 20.9% |
| Standard Deviation (Population) | 10.3% | 20.4% |
Demographics Similar to Immigrants from Korea and Immigrants from Turkey by Seniors Poverty Over the Age of 65
In terms of seniors poverty over the age of 65, the demographic groups most similar to Immigrants from Korea are Immigrants from Romania (10.3%, a difference of 0.040%), Immigrants from Denmark (10.3%, a difference of 0.23%), Immigrants from Italy (10.3%, a difference of 0.27%), Pakistani (10.3%, a difference of 0.42%), and Lebanese (10.3%, a difference of 0.48%). Similarly, the demographic groups most similar to Immigrants from Turkey are Egyptian (10.5%, a difference of 0.010%), Immigrants from Oceania (10.4%, a difference of 0.16%), Immigrants from Iran (10.4%, a difference of 0.17%), Ottawa (10.4%, a difference of 0.19%), and Immigrants from Hungary (10.4%, a difference of 0.32%).
| Demographics | Rating | Rank | Seniors Poverty Over the Age of 65 |
| Immigrants | Korea | 93.3 /100 | #112 | Exceptional 10.3% |
| Immigrants | Romania | 93.3 /100 | #113 | Exceptional 10.3% |
| Immigrants | Denmark | 92.7 /100 | #114 | Exceptional 10.3% |
| Immigrants | Italy | 92.6 /100 | #115 | Exceptional 10.3% |
| Pakistanis | 92.2 /100 | #116 | Exceptional 10.3% |
| Lebanese | 92.0 /100 | #117 | Exceptional 10.3% |
| Okinawans | 91.7 /100 | #118 | Exceptional 10.4% |
| Immigrants | Western Europe | 91.1 /100 | #119 | Exceptional 10.4% |
| Immigrants | Bosnia and Herzegovina | 90.8 /100 | #120 | Exceptional 10.4% |
| Immigrants | Iraq | 90.7 /100 | #121 | Exceptional 10.4% |
| Immigrants | Moldova | 90.7 /100 | #122 | Exceptional 10.4% |
| Hmong | 90.0 /100 | #123 | Exceptional 10.4% |
| Asians | 89.9 /100 | #124 | Excellent 10.4% |
| Immigrants | Philippines | 89.4 /100 | #125 | Excellent 10.4% |
| Immigrants | Hungary | 89.1 /100 | #126 | Excellent 10.4% |
| Cambodians | 89.1 /100 | #127 | Excellent 10.4% |
| Ottawa | 88.5 /100 | #128 | Excellent 10.4% |
| Immigrants | Iran | 88.4 /100 | #129 | Excellent 10.4% |
| Immigrants | Oceania | 88.4 /100 | #130 | Excellent 10.4% |
| Egyptians | 87.8 /100 | #131 | Excellent 10.5% |
| Immigrants | Turkey | 87.7 /100 | #132 | Excellent 10.5% |