Immigrants from Bulgaria vs Immigrants from Moldova Child Poverty Among Boys Under 16
COMPARE
Immigrants from Bulgaria
Immigrants from Moldova
Child Poverty Among Boys Under 16
Child Poverty Among Boys Under 16 Comparison
Immigrants from Bulgaria
Immigrants from Moldova
14.5%
CHILD POVERTY AMONG BOYS UNDER 16
98.5/ 100
METRIC RATING
66th/ 347
METRIC RANK
14.1%
CHILD POVERTY AMONG BOYS UNDER 16
99.4/ 100
METRIC RATING
47th/ 347
METRIC RANK
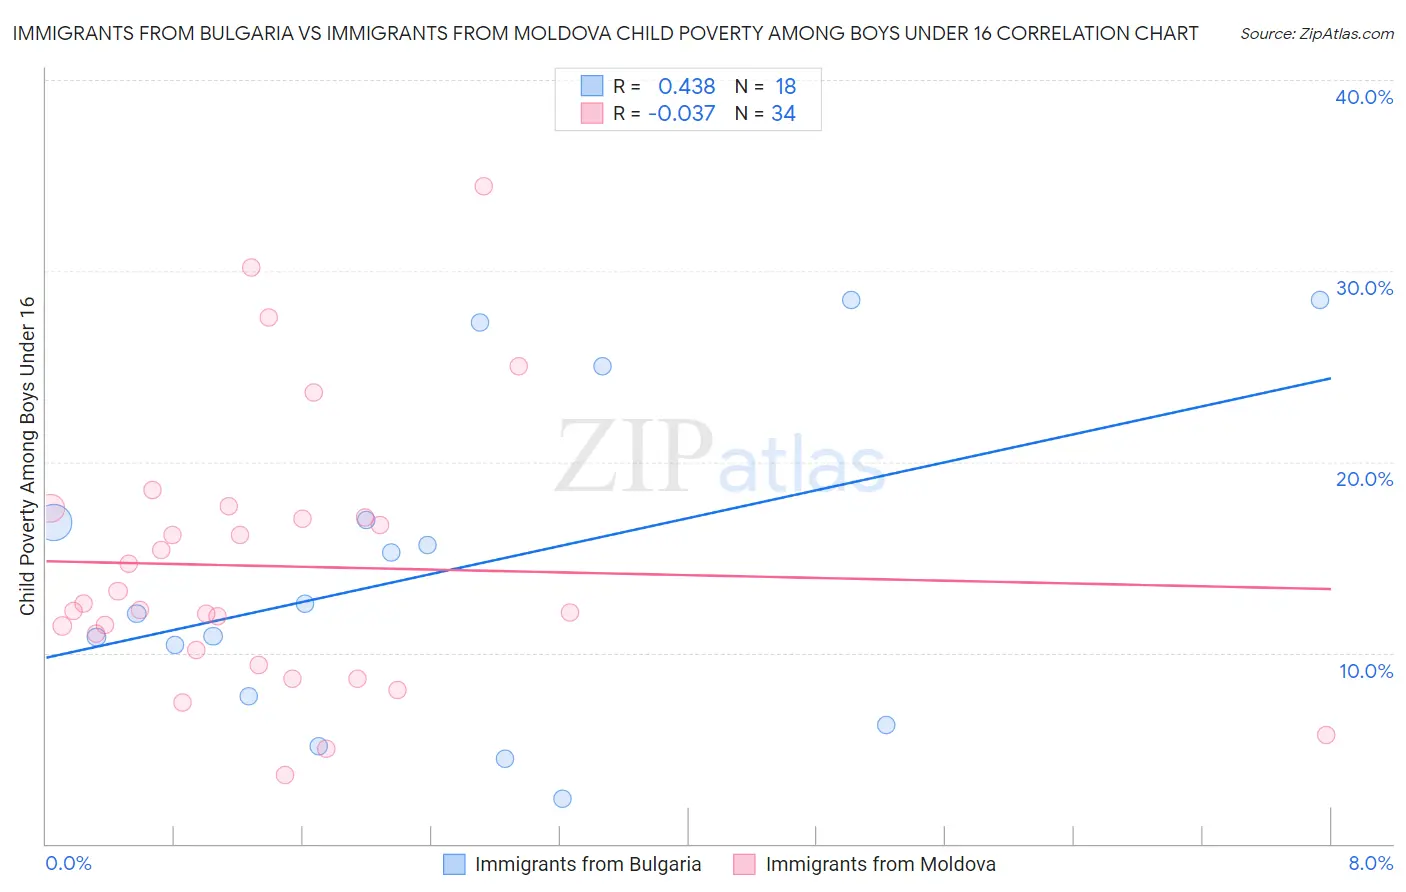
Immigrants from Bulgaria vs Immigrants from Moldova Child Poverty Among Boys Under 16 Correlation Chart
The statistical analysis conducted on geographies consisting of 171,062,513 people shows a moderate positive correlation between the proportion of Immigrants from Bulgaria and poverty level among boys under the age of 16 in the United States with a correlation coefficient (R) of 0.438 and weighted average of 14.5%. Similarly, the statistical analysis conducted on geographies consisting of 123,426,416 people shows no correlation between the proportion of Immigrants from Moldova and poverty level among boys under the age of 16 in the United States with a correlation coefficient (R) of -0.037 and weighted average of 14.1%, a difference of 2.9%.
Child Poverty Among Boys Under 16 Correlation Summary
| Measurement | Immigrants from Bulgaria | Immigrants from Moldova |
| Minimum | 2.3% | 3.6% |
| Maximum | 28.5% | 34.4% |
| Range | 26.1% | 30.8% |
| Mean | 14.2% | 14.5% |
| Median | 12.3% | 12.4% |
| Interquartile 25% (IQ1) | 7.7% | 10.1% |
| Interquartile 75% (IQ3) | 17.0% | 17.1% |
| Interquartile Range (IQR) | 9.3% | 6.9% |
| Standard Deviation (Sample) | 8.3% | 7.0% |
| Standard Deviation (Population) | 8.1% | 6.9% |
Demographics Similar to Immigrants from Bulgaria and Immigrants from Moldova by Child Poverty Among Boys Under 16
In terms of child poverty among boys under 16, the demographic groups most similar to Immigrants from Bulgaria are Soviet Union (14.5%, a difference of 0.010%), Immigrants from Romania (14.5%, a difference of 0.030%), Cambodian (14.5%, a difference of 0.17%), Immigrants from Israel (14.4%, a difference of 0.61%), and Scandinavian (14.4%, a difference of 0.93%). Similarly, the demographic groups most similar to Immigrants from Moldova are Immigrants from Indonesia (14.1%, a difference of 0.020%), Czech (14.1%, a difference of 0.11%), Greek (14.1%, a difference of 0.27%), Italian (14.2%, a difference of 0.59%), and Immigrants from Greece (14.2%, a difference of 0.73%).
| Demographics | Rating | Rank | Child Poverty Among Boys Under 16 |
| Greeks | 99.4 /100 | #46 | Exceptional 14.1% |
| Immigrants | Moldova | 99.4 /100 | #47 | Exceptional 14.1% |
| Immigrants | Indonesia | 99.4 /100 | #48 | Exceptional 14.1% |
| Czechs | 99.3 /100 | #49 | Exceptional 14.1% |
| Italians | 99.2 /100 | #50 | Exceptional 14.2% |
| Immigrants | Greece | 99.2 /100 | #51 | Exceptional 14.2% |
| Laotians | 99.0 /100 | #52 | Exceptional 14.3% |
| Immigrants | Philippines | 99.0 /100 | #53 | Exceptional 14.3% |
| Immigrants | Serbia | 99.0 /100 | #54 | Exceptional 14.3% |
| Immigrants | Pakistan | 99.0 /100 | #55 | Exceptional 14.3% |
| Zimbabweans | 99.0 /100 | #56 | Exceptional 14.3% |
| Poles | 98.9 /100 | #57 | Exceptional 14.4% |
| Immigrants | Sweden | 98.9 /100 | #58 | Exceptional 14.4% |
| Immigrants | Czechoslovakia | 98.9 /100 | #59 | Exceptional 14.4% |
| Immigrants | Belgium | 98.9 /100 | #60 | Exceptional 14.4% |
| Scandinavians | 98.8 /100 | #61 | Exceptional 14.4% |
| Immigrants | Israel | 98.7 /100 | #62 | Exceptional 14.4% |
| Cambodians | 98.5 /100 | #63 | Exceptional 14.5% |
| Immigrants | Romania | 98.5 /100 | #64 | Exceptional 14.5% |
| Soviet Union | 98.5 /100 | #65 | Exceptional 14.5% |
| Immigrants | Bulgaria | 98.5 /100 | #66 | Exceptional 14.5% |