Scandinavian vs Immigrants from Uganda Male Poverty
COMPARE
Scandinavian
Immigrants from Uganda
Male Poverty
Male Poverty Comparison
Scandinavians
Immigrants from Uganda
10.1%
MALE POVERTY
98.0/ 100
METRIC RATING
58th/ 347
METRIC RANK
11.8%
MALE POVERTY
8.5/ 100
METRIC RATING
204th/ 347
METRIC RANK
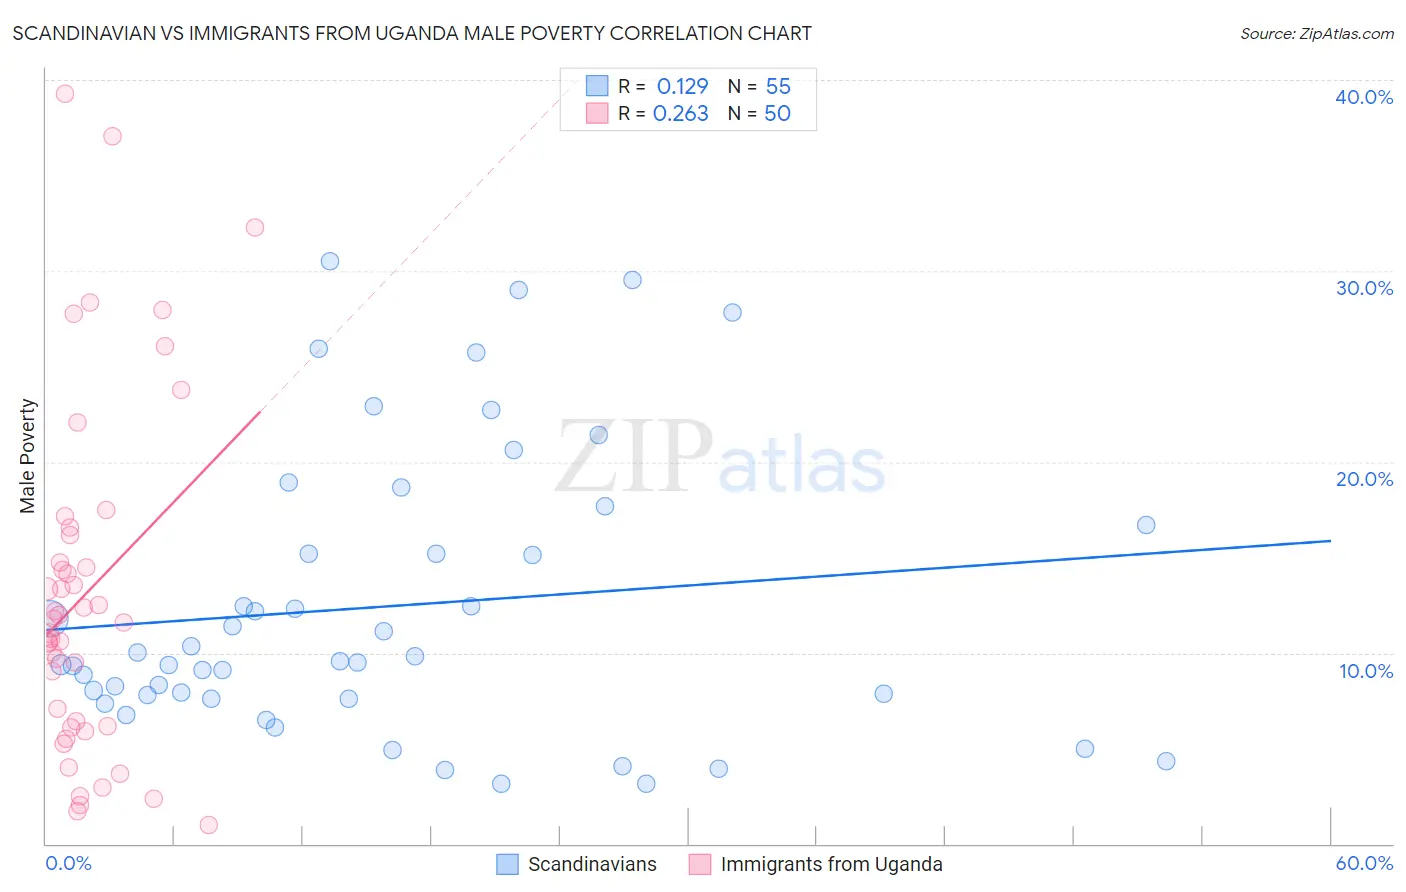
Scandinavian vs Immigrants from Uganda Male Poverty Correlation Chart
The statistical analysis conducted on geographies consisting of 471,949,294 people shows a poor positive correlation between the proportion of Scandinavians and poverty level among males in the United States with a correlation coefficient (R) of 0.129 and weighted average of 10.1%. Similarly, the statistical analysis conducted on geographies consisting of 125,960,451 people shows a weak positive correlation between the proportion of Immigrants from Uganda and poverty level among males in the United States with a correlation coefficient (R) of 0.263 and weighted average of 11.8%, a difference of 17.0%.
Male Poverty Correlation Summary
| Measurement | Scandinavian | Immigrants from Uganda |
| Minimum | 3.2% | 0.96% |
| Maximum | 30.5% | 39.3% |
| Range | 27.3% | 38.3% |
| Mean | 12.4% | 13.1% |
| Median | 9.6% | 11.7% |
| Interquartile 25% (IQ1) | 7.6% | 6.2% |
| Interquartile 75% (IQ3) | 16.7% | 16.2% |
| Interquartile Range (IQR) | 9.0% | 10.0% |
| Standard Deviation (Sample) | 7.4% | 9.1% |
| Standard Deviation (Population) | 7.3% | 9.0% |
Similar Demographics by Male Poverty
Demographics Similar to Scandinavians by Male Poverty
In terms of male poverty, the demographic groups most similar to Scandinavians are Estonian (10.1%, a difference of 0.070%), Immigrants from Europe (10.1%, a difference of 0.13%), Immigrants from Bulgaria (10.1%, a difference of 0.22%), Ukrainian (10.1%, a difference of 0.22%), and Austrian (10.1%, a difference of 0.24%).
| Demographics | Rating | Rank | Male Poverty |
| Immigrants | Croatia | 98.7 /100 | #51 | Exceptional 10.0% |
| Asians | 98.7 /100 | #52 | Exceptional 10.0% |
| Immigrants | Czechoslovakia | 98.6 /100 | #53 | Exceptional 10.0% |
| Immigrants | Austria | 98.5 /100 | #54 | Exceptional 10.0% |
| Germans | 98.3 /100 | #55 | Exceptional 10.1% |
| Immigrants | Bulgaria | 98.2 /100 | #56 | Exceptional 10.1% |
| Estonians | 98.1 /100 | #57 | Exceptional 10.1% |
| Scandinavians | 98.0 /100 | #58 | Exceptional 10.1% |
| Immigrants | Europe | 97.9 /100 | #59 | Exceptional 10.1% |
| Ukrainians | 97.9 /100 | #60 | Exceptional 10.1% |
| Austrians | 97.8 /100 | #61 | Exceptional 10.1% |
| Immigrants | Italy | 97.8 /100 | #62 | Exceptional 10.2% |
| Slovaks | 97.7 /100 | #63 | Exceptional 10.2% |
| Swiss | 97.5 /100 | #64 | Exceptional 10.2% |
| Zimbabweans | 97.5 /100 | #65 | Exceptional 10.2% |
Demographics Similar to Immigrants from Uganda by Male Poverty
In terms of male poverty, the demographic groups most similar to Immigrants from Uganda are Immigrants from Western Asia (11.8%, a difference of 0.36%), Aleut (11.8%, a difference of 0.50%), Panamanian (11.9%, a difference of 0.78%), Immigrants from Eastern Africa (12.0%, a difference of 1.1%), and Spaniard (11.7%, a difference of 1.2%).
| Demographics | Rating | Rank | Male Poverty |
| Delaware | 15.4 /100 | #197 | Poor 11.7% |
| Iraqis | 14.7 /100 | #198 | Poor 11.7% |
| Spanish | 14.1 /100 | #199 | Poor 11.7% |
| Immigrants | Lebanon | 13.6 /100 | #200 | Poor 11.7% |
| Spaniards | 13.5 /100 | #201 | Poor 11.7% |
| Aleuts | 10.4 /100 | #202 | Poor 11.8% |
| Immigrants | Western Asia | 9.8 /100 | #203 | Tragic 11.8% |
| Immigrants | Uganda | 8.5 /100 | #204 | Tragic 11.8% |
| Panamanians | 6.2 /100 | #205 | Tragic 11.9% |
| Immigrants | Eastern Africa | 5.4 /100 | #206 | Tragic 12.0% |
| Malaysians | 5.2 /100 | #207 | Tragic 12.0% |
| Immigrants | Immigrants | 4.5 /100 | #208 | Tragic 12.0% |
| Immigrants | Azores | 4.3 /100 | #209 | Tragic 12.0% |
| Moroccans | 4.2 /100 | #210 | Tragic 12.0% |
| Immigrants | Panama | 4.0 /100 | #211 | Tragic 12.1% |