Scandinavian vs Immigrants from Barbados Unemployment Among Ages 25 to 29 years
COMPARE
Scandinavian
Immigrants from Barbados
Unemployment Among Ages 25 to 29 years
Unemployment Among Ages 25 to 29 years Comparison
Scandinavians
Immigrants from Barbados
6.3%
UNEMPLOYMENT AMONG AGES 25 TO 29 YEARS
97.4/ 100
METRIC RATING
72nd/ 347
METRIC RANK
8.0%
UNEMPLOYMENT AMONG AGES 25 TO 29 YEARS
0.0/ 100
METRIC RATING
307th/ 347
METRIC RANK
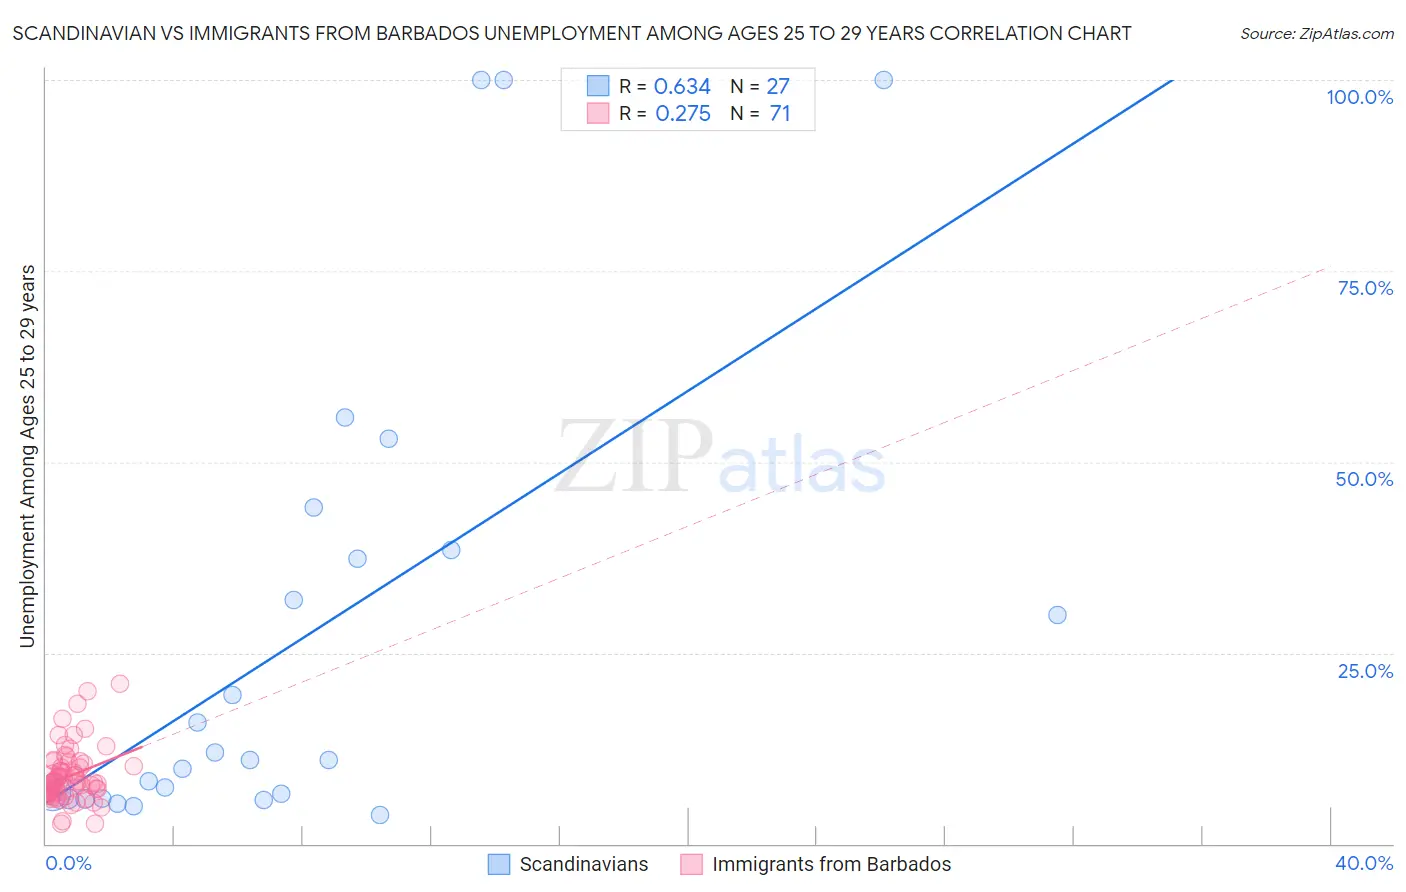
Scandinavian vs Immigrants from Barbados Unemployment Among Ages 25 to 29 years Correlation Chart
The statistical analysis conducted on geographies consisting of 433,811,713 people shows a significant positive correlation between the proportion of Scandinavians and unemployment rate among population between the ages 25 and 29 in the United States with a correlation coefficient (R) of 0.634 and weighted average of 6.3%. Similarly, the statistical analysis conducted on geographies consisting of 111,437,258 people shows a weak positive correlation between the proportion of Immigrants from Barbados and unemployment rate among population between the ages 25 and 29 in the United States with a correlation coefficient (R) of 0.275 and weighted average of 8.0%, a difference of 28.2%.
Unemployment Among Ages 25 to 29 years Correlation Summary
| Measurement | Scandinavian | Immigrants from Barbados |
| Minimum | 3.8% | 2.6% |
| Maximum | 100.0% | 21.0% |
| Range | 96.2% | 18.4% |
| Mean | 27.3% | 8.8% |
| Median | 11.0% | 8.1% |
| Interquartile 25% (IQ1) | 6.0% | 6.7% |
| Interquartile 75% (IQ3) | 38.5% | 10.2% |
| Interquartile Range (IQR) | 32.5% | 3.5% |
| Standard Deviation (Sample) | 30.5% | 3.6% |
| Standard Deviation (Population) | 29.9% | 3.5% |
Similar Demographics by Unemployment Among Ages 25 to 29 years
Demographics Similar to Scandinavians by Unemployment Among Ages 25 to 29 years
In terms of unemployment among ages 25 to 29 years, the demographic groups most similar to Scandinavians are Immigrants from France (6.3%, a difference of 0.020%), Immigrants from Malaysia (6.3%, a difference of 0.060%), Immigrants from Hong Kong (6.3%, a difference of 0.080%), Belgian (6.3%, a difference of 0.25%), and Palestinian (6.3%, a difference of 0.26%).
| Demographics | Rating | Rank | Unemployment Among Ages 25 to 29 years |
| Immigrants | Lebanon | 97.8 /100 | #65 | Exceptional 6.3% |
| Indians (Asian) | 97.8 /100 | #66 | Exceptional 6.3% |
| Immigrants | Northern Africa | 97.8 /100 | #67 | Exceptional 6.3% |
| Palestinians | 97.7 /100 | #68 | Exceptional 6.3% |
| Immigrants | Hong Kong | 97.5 /100 | #69 | Exceptional 6.3% |
| Immigrants | Malaysia | 97.5 /100 | #70 | Exceptional 6.3% |
| Immigrants | France | 97.4 /100 | #71 | Exceptional 6.3% |
| Scandinavians | 97.4 /100 | #72 | Exceptional 6.3% |
| Belgians | 97.0 /100 | #73 | Exceptional 6.3% |
| Carpatho Rusyns | 96.9 /100 | #74 | Exceptional 6.3% |
| Immigrants | Jordan | 96.8 /100 | #75 | Exceptional 6.3% |
| Immigrants | Korea | 96.7 /100 | #76 | Exceptional 6.3% |
| Icelanders | 96.6 /100 | #77 | Exceptional 6.3% |
| Asians | 96.4 /100 | #78 | Exceptional 6.3% |
| Immigrants | Switzerland | 96.0 /100 | #79 | Exceptional 6.3% |
Demographics Similar to Immigrants from Barbados by Unemployment Among Ages 25 to 29 years
In terms of unemployment among ages 25 to 29 years, the demographic groups most similar to Immigrants from Barbados are Haitian (8.0%, a difference of 0.16%), Tsimshian (8.0%, a difference of 0.24%), Immigrants from Jamaica (8.1%, a difference of 0.42%), Immigrants from Haiti (8.1%, a difference of 0.43%), and U.S. Virgin Islander (8.1%, a difference of 0.44%).
| Demographics | Rating | Rank | Unemployment Among Ages 25 to 29 years |
| Central American Indians | 0.0 /100 | #300 | Tragic 7.9% |
| West Indians | 0.0 /100 | #301 | Tragic 7.9% |
| Jamaicans | 0.0 /100 | #302 | Tragic 7.9% |
| Immigrants | Yemen | 0.0 /100 | #303 | Tragic 8.0% |
| Cajuns | 0.0 /100 | #304 | Tragic 8.0% |
| Tsimshian | 0.0 /100 | #305 | Tragic 8.0% |
| Haitians | 0.0 /100 | #306 | Tragic 8.0% |
| Immigrants | Barbados | 0.0 /100 | #307 | Tragic 8.0% |
| Immigrants | Jamaica | 0.0 /100 | #308 | Tragic 8.1% |
| Immigrants | Haiti | 0.0 /100 | #309 | Tragic 8.1% |
| U.S. Virgin Islanders | 0.0 /100 | #310 | Tragic 8.1% |
| Immigrants | Azores | 0.0 /100 | #311 | Tragic 8.1% |
| Dutch West Indians | 0.0 /100 | #312 | Tragic 8.2% |
| Immigrants | St. Vincent and the Grenadines | 0.0 /100 | #313 | Tragic 8.4% |
| Immigrants | Dominica | 0.0 /100 | #314 | Tragic 8.4% |