Immigrants from Southern Europe vs Bahamian Child Poverty Among Girls Under 16
COMPARE
Immigrants from Southern Europe
Bahamian
Child Poverty Among Girls Under 16
Child Poverty Among Girls Under 16 Comparison
Immigrants from Southern Europe
Bahamians
15.3%
CHILD POVERTY AMONG GIRLS UNDER 16
92.7/ 100
METRIC RATING
118th/ 347
METRIC RANK
21.5%
CHILD POVERTY AMONG GIRLS UNDER 16
0.0/ 100
METRIC RATING
309th/ 347
METRIC RANK
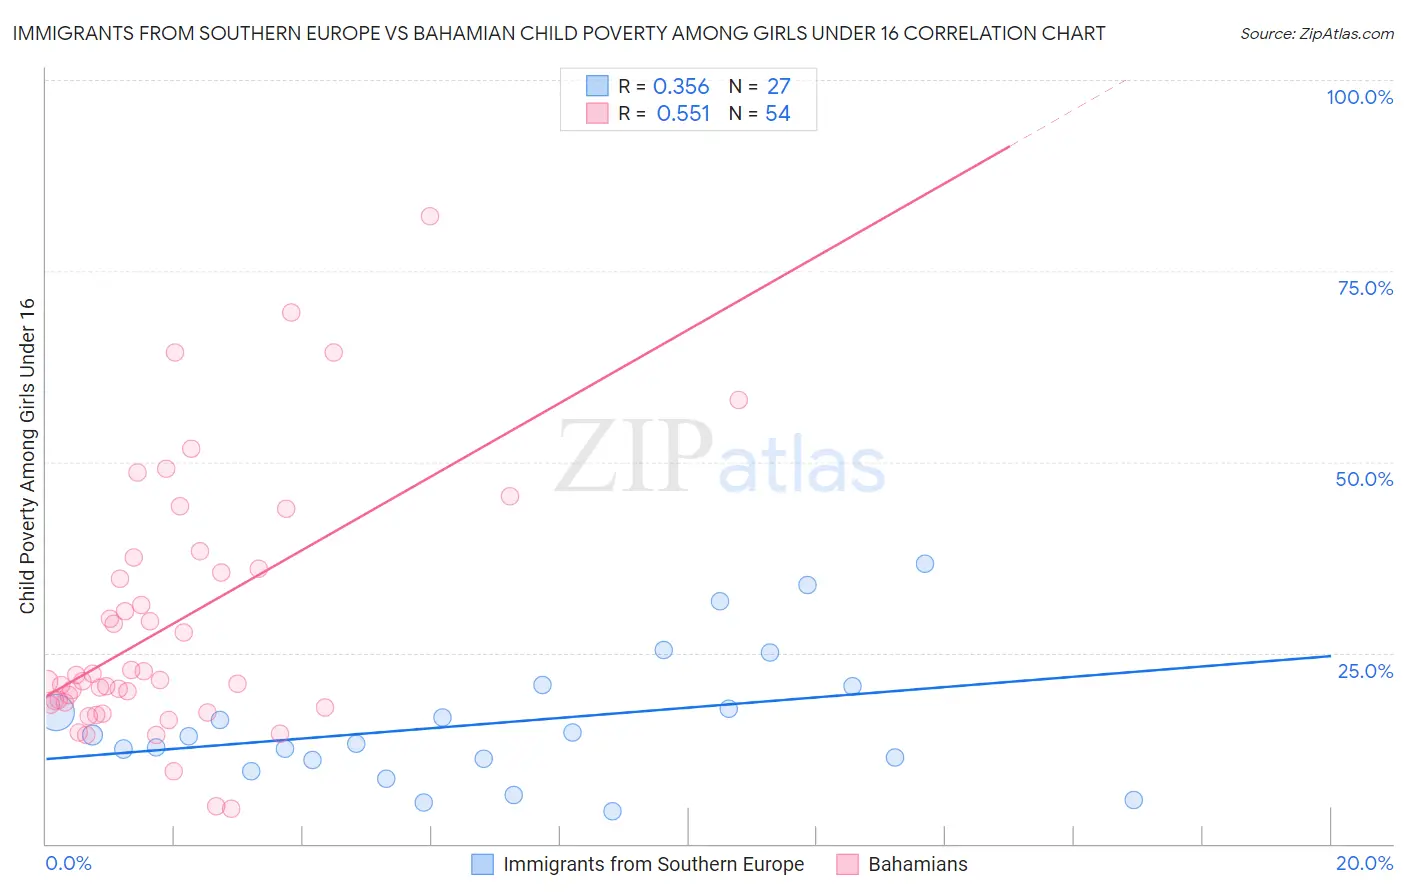
Immigrants from Southern Europe vs Bahamian Child Poverty Among Girls Under 16 Correlation Chart
The statistical analysis conducted on geographies consisting of 393,086,962 people shows a mild positive correlation between the proportion of Immigrants from Southern Europe and poverty level among girls under the age of 16 in the United States with a correlation coefficient (R) of 0.356 and weighted average of 15.3%. Similarly, the statistical analysis conducted on geographies consisting of 112,230,228 people shows a substantial positive correlation between the proportion of Bahamians and poverty level among girls under the age of 16 in the United States with a correlation coefficient (R) of 0.551 and weighted average of 21.5%, a difference of 40.9%.
Child Poverty Among Girls Under 16 Correlation Summary
| Measurement | Immigrants from Southern Europe | Bahamian |
| Minimum | 4.3% | 4.6% |
| Maximum | 36.6% | 82.1% |
| Range | 32.4% | 77.5% |
| Mean | 15.9% | 28.7% |
| Median | 14.1% | 21.4% |
| Interquartile 25% (IQ1) | 11.0% | 18.2% |
| Interquartile 75% (IQ3) | 20.6% | 36.0% |
| Interquartile Range (IQR) | 9.6% | 17.8% |
| Standard Deviation (Sample) | 8.5% | 16.7% |
| Standard Deviation (Population) | 8.4% | 16.5% |
Similar Demographics by Child Poverty Among Girls Under 16
Demographics Similar to Immigrants from Southern Europe by Child Poverty Among Girls Under 16
In terms of child poverty among girls under 16, the demographic groups most similar to Immigrants from Southern Europe are Immigrants from Zimbabwe (15.3%, a difference of 0.11%), Immigrants from North Macedonia (15.2%, a difference of 0.18%), Pakistani (15.3%, a difference of 0.20%), English (15.3%, a difference of 0.22%), and Immigrants from Denmark (15.2%, a difference of 0.28%).
| Demographics | Rating | Rank | Child Poverty Among Girls Under 16 |
| Palestinians | 94.5 /100 | #111 | Exceptional 15.1% |
| Immigrants | Kazakhstan | 94.3 /100 | #112 | Exceptional 15.1% |
| Dutch | 94.3 /100 | #113 | Exceptional 15.1% |
| Sri Lankans | 94.0 /100 | #114 | Exceptional 15.2% |
| Belgians | 93.9 /100 | #115 | Exceptional 15.2% |
| Immigrants | Denmark | 93.3 /100 | #116 | Exceptional 15.2% |
| Immigrants | North Macedonia | 93.1 /100 | #117 | Exceptional 15.2% |
| Immigrants | Southern Europe | 92.7 /100 | #118 | Exceptional 15.3% |
| Immigrants | Zimbabwe | 92.5 /100 | #119 | Exceptional 15.3% |
| Pakistanis | 92.3 /100 | #120 | Exceptional 15.3% |
| English | 92.2 /100 | #121 | Exceptional 15.3% |
| Portuguese | 91.8 /100 | #122 | Exceptional 15.3% |
| Irish | 91.5 /100 | #123 | Exceptional 15.3% |
| Carpatho Rusyns | 91.4 /100 | #124 | Exceptional 15.3% |
| Peruvians | 91.2 /100 | #125 | Exceptional 15.4% |
Demographics Similar to Bahamians by Child Poverty Among Girls Under 16
In terms of child poverty among girls under 16, the demographic groups most similar to Bahamians are Houma (21.5%, a difference of 0.12%), Immigrants from Somalia (21.6%, a difference of 0.27%), Immigrants from Bahamas (21.4%, a difference of 0.30%), Immigrants from Central America (21.4%, a difference of 0.31%), and Dutch West Indian (21.6%, a difference of 0.33%).
| Demographics | Rating | Rank | Child Poverty Among Girls Under 16 |
| Seminole | 0.0 /100 | #302 | Tragic 21.2% |
| British West Indians | 0.0 /100 | #303 | Tragic 21.3% |
| Indonesians | 0.0 /100 | #304 | Tragic 21.3% |
| Guatemalans | 0.0 /100 | #305 | Tragic 21.4% |
| Immigrants | Central America | 0.0 /100 | #306 | Tragic 21.4% |
| Immigrants | Bahamas | 0.0 /100 | #307 | Tragic 21.4% |
| Houma | 0.0 /100 | #308 | Tragic 21.5% |
| Bahamians | 0.0 /100 | #309 | Tragic 21.5% |
| Immigrants | Somalia | 0.0 /100 | #310 | Tragic 21.6% |
| Dutch West Indians | 0.0 /100 | #311 | Tragic 21.6% |
| Immigrants | Mexico | 0.0 /100 | #312 | Tragic 21.6% |
| Creek | 0.0 /100 | #313 | Tragic 21.7% |
| Arapaho | 0.0 /100 | #314 | Tragic 21.7% |
| Ute | 0.0 /100 | #315 | Tragic 21.8% |
| Immigrants | Guatemala | 0.0 /100 | #316 | Tragic 21.9% |