Immigrants from Belize vs Bahamian Child Poverty Among Girls Under 16
COMPARE
Immigrants from Belize
Bahamian
Child Poverty Among Girls Under 16
Child Poverty Among Girls Under 16 Comparison
Immigrants from Belize
Bahamians
20.6%
CHILD POVERTY AMONG GIRLS UNDER 16
0.0/ 100
METRIC RATING
289th/ 347
METRIC RANK
21.5%
CHILD POVERTY AMONG GIRLS UNDER 16
0.0/ 100
METRIC RATING
309th/ 347
METRIC RANK
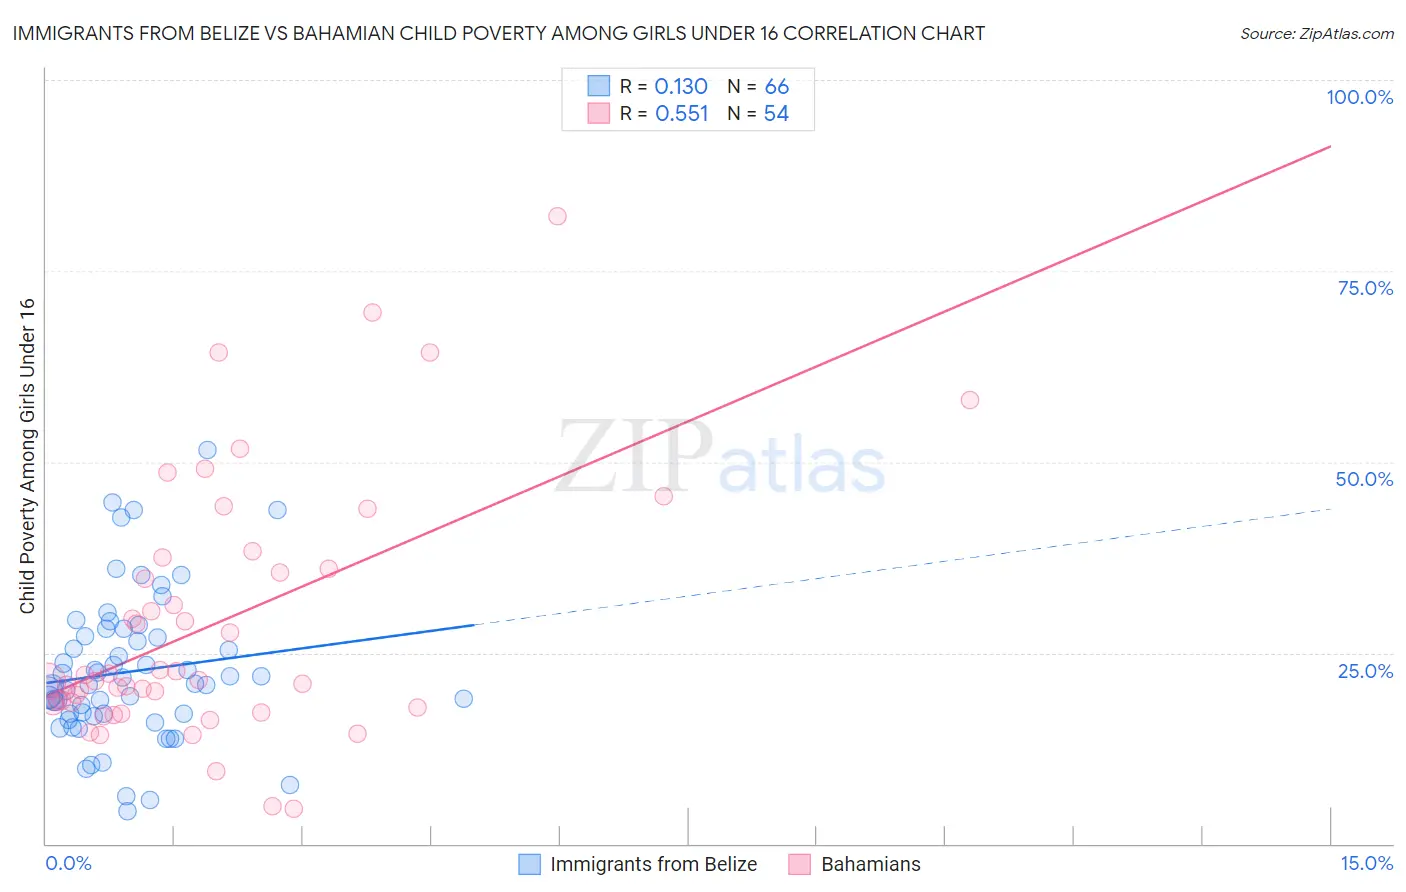
Immigrants from Belize vs Bahamian Child Poverty Among Girls Under 16 Correlation Chart
The statistical analysis conducted on geographies consisting of 129,800,112 people shows a poor positive correlation between the proportion of Immigrants from Belize and poverty level among girls under the age of 16 in the United States with a correlation coefficient (R) of 0.130 and weighted average of 20.6%. Similarly, the statistical analysis conducted on geographies consisting of 112,230,228 people shows a substantial positive correlation between the proportion of Bahamians and poverty level among girls under the age of 16 in the United States with a correlation coefficient (R) of 0.551 and weighted average of 21.5%, a difference of 4.4%.
Child Poverty Among Girls Under 16 Correlation Summary
| Measurement | Immigrants from Belize | Bahamian |
| Minimum | 4.3% | 4.6% |
| Maximum | 51.6% | 82.1% |
| Range | 47.3% | 77.5% |
| Mean | 22.5% | 28.7% |
| Median | 20.9% | 21.4% |
| Interquartile 25% (IQ1) | 17.0% | 18.2% |
| Interquartile 75% (IQ3) | 27.2% | 36.0% |
| Interquartile Range (IQR) | 10.2% | 17.8% |
| Standard Deviation (Sample) | 9.6% | 16.7% |
| Standard Deviation (Population) | 9.6% | 16.5% |
Demographics Similar to Immigrants from Belize and Bahamians by Child Poverty Among Girls Under 16
In terms of child poverty among girls under 16, the demographic groups most similar to Immigrants from Belize are Immigrants from Haiti (20.6%, a difference of 0.070%), Chippewa (20.6%, a difference of 0.20%), Immigrants from Latin America (20.6%, a difference of 0.27%), Immigrants from Grenada (20.7%, a difference of 0.31%), and Immigrants from Senegal (20.7%, a difference of 0.43%). Similarly, the demographic groups most similar to Bahamians are Houma (21.5%, a difference of 0.12%), Immigrants from Bahamas (21.4%, a difference of 0.30%), Immigrants from Central America (21.4%, a difference of 0.31%), Guatemalan (21.4%, a difference of 0.48%), and Indonesian (21.3%, a difference of 1.1%).
| Demographics | Rating | Rank | Child Poverty Among Girls Under 16 |
| Immigrants | Belize | 0.0 /100 | #289 | Tragic 20.6% |
| Immigrants | Haiti | 0.0 /100 | #290 | Tragic 20.6% |
| Chippewa | 0.0 /100 | #291 | Tragic 20.6% |
| Immigrants | Latin America | 0.0 /100 | #292 | Tragic 20.6% |
| Immigrants | Grenada | 0.0 /100 | #293 | Tragic 20.7% |
| Immigrants | Senegal | 0.0 /100 | #294 | Tragic 20.7% |
| Immigrants | Caribbean | 0.0 /100 | #295 | Tragic 20.7% |
| Immigrants | West Indies | 0.0 /100 | #296 | Tragic 20.7% |
| Inupiat | 0.0 /100 | #297 | Tragic 20.8% |
| Mexicans | 0.0 /100 | #298 | Tragic 20.9% |
| Hispanics or Latinos | 0.0 /100 | #299 | Tragic 21.0% |
| Somalis | 0.0 /100 | #300 | Tragic 21.0% |
| Choctaw | 0.0 /100 | #301 | Tragic 21.1% |
| Seminole | 0.0 /100 | #302 | Tragic 21.2% |
| British West Indians | 0.0 /100 | #303 | Tragic 21.3% |
| Indonesians | 0.0 /100 | #304 | Tragic 21.3% |
| Guatemalans | 0.0 /100 | #305 | Tragic 21.4% |
| Immigrants | Central America | 0.0 /100 | #306 | Tragic 21.4% |
| Immigrants | Bahamas | 0.0 /100 | #307 | Tragic 21.4% |
| Houma | 0.0 /100 | #308 | Tragic 21.5% |
| Bahamians | 0.0 /100 | #309 | Tragic 21.5% |