Immigrants from South America vs Bahamian Child Poverty Among Girls Under 16
COMPARE
Immigrants from South America
Bahamian
Child Poverty Among Girls Under 16
Child Poverty Among Girls Under 16 Comparison
Immigrants from South America
Bahamians
16.4%
CHILD POVERTY AMONG GIRLS UNDER 16
55.1/ 100
METRIC RATING
173rd/ 347
METRIC RANK
21.5%
CHILD POVERTY AMONG GIRLS UNDER 16
0.0/ 100
METRIC RATING
309th/ 347
METRIC RANK
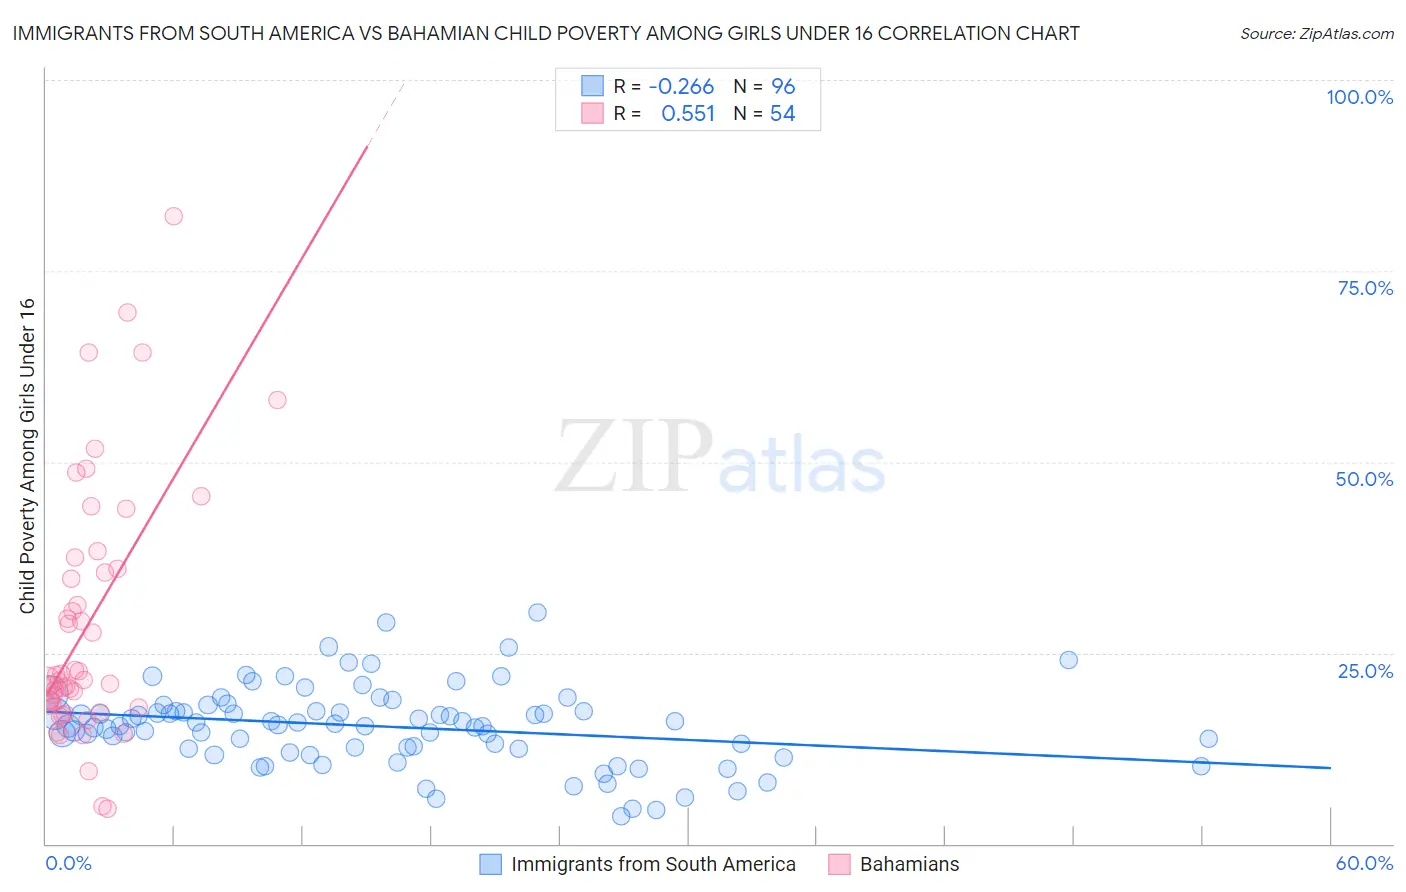
Immigrants from South America vs Bahamian Child Poverty Among Girls Under 16 Correlation Chart
The statistical analysis conducted on geographies consisting of 473,703,980 people shows a weak negative correlation between the proportion of Immigrants from South America and poverty level among girls under the age of 16 in the United States with a correlation coefficient (R) of -0.266 and weighted average of 16.4%. Similarly, the statistical analysis conducted on geographies consisting of 112,230,228 people shows a substantial positive correlation between the proportion of Bahamians and poverty level among girls under the age of 16 in the United States with a correlation coefficient (R) of 0.551 and weighted average of 21.5%, a difference of 31.4%.
Child Poverty Among Girls Under 16 Correlation Summary
| Measurement | Immigrants from South America | Bahamian |
| Minimum | 3.7% | 4.6% |
| Maximum | 30.3% | 82.1% |
| Range | 26.7% | 77.5% |
| Mean | 15.4% | 28.7% |
| Median | 15.5% | 21.4% |
| Interquartile 25% (IQ1) | 12.5% | 18.2% |
| Interquartile 75% (IQ3) | 17.4% | 36.0% |
| Interquartile Range (IQR) | 4.9% | 17.8% |
| Standard Deviation (Sample) | 5.2% | 16.7% |
| Standard Deviation (Population) | 5.1% | 16.5% |
Similar Demographics by Child Poverty Among Girls Under 16
Demographics Similar to Immigrants from South America by Child Poverty Among Girls Under 16
In terms of child poverty among girls under 16, the demographic groups most similar to Immigrants from South America are Ethiopian (16.5%, a difference of 0.59%), Afghan (16.2%, a difference of 0.88%), Immigrants from Saudi Arabia (16.2%, a difference of 1.1%), Costa Rican (16.2%, a difference of 1.1%), and Immigrants from Venezuela (16.2%, a difference of 1.1%).
| Demographics | Rating | Rank | Child Poverty Among Girls Under 16 |
| South Americans | 67.2 /100 | #166 | Good 16.1% |
| Uruguayans | 64.7 /100 | #167 | Good 16.2% |
| Yugoslavians | 64.4 /100 | #168 | Good 16.2% |
| Costa Ricans | 64.2 /100 | #169 | Good 16.2% |
| Immigrants | Venezuela | 64.2 /100 | #170 | Good 16.2% |
| Immigrants | Saudi Arabia | 64.0 /100 | #171 | Good 16.2% |
| Afghans | 62.3 /100 | #172 | Good 16.2% |
| Immigrants | South America | 55.1 /100 | #173 | Average 16.4% |
| Ethiopians | 50.0 /100 | #174 | Average 16.5% |
| Lebanese | 45.4 /100 | #175 | Average 16.6% |
| Hungarians | 45.1 /100 | #176 | Average 16.6% |
| Immigrants | Western Asia | 44.1 /100 | #177 | Average 16.6% |
| Whites/Caucasians | 43.6 /100 | #178 | Average 16.6% |
| Hawaiians | 43.4 /100 | #179 | Average 16.6% |
| Immigrants | Syria | 43.3 /100 | #180 | Average 16.6% |
Demographics Similar to Bahamians by Child Poverty Among Girls Under 16
In terms of child poverty among girls under 16, the demographic groups most similar to Bahamians are Houma (21.5%, a difference of 0.12%), Immigrants from Somalia (21.6%, a difference of 0.27%), Immigrants from Bahamas (21.4%, a difference of 0.30%), Immigrants from Central America (21.4%, a difference of 0.31%), and Dutch West Indian (21.6%, a difference of 0.33%).
| Demographics | Rating | Rank | Child Poverty Among Girls Under 16 |
| Seminole | 0.0 /100 | #302 | Tragic 21.2% |
| British West Indians | 0.0 /100 | #303 | Tragic 21.3% |
| Indonesians | 0.0 /100 | #304 | Tragic 21.3% |
| Guatemalans | 0.0 /100 | #305 | Tragic 21.4% |
| Immigrants | Central America | 0.0 /100 | #306 | Tragic 21.4% |
| Immigrants | Bahamas | 0.0 /100 | #307 | Tragic 21.4% |
| Houma | 0.0 /100 | #308 | Tragic 21.5% |
| Bahamians | 0.0 /100 | #309 | Tragic 21.5% |
| Immigrants | Somalia | 0.0 /100 | #310 | Tragic 21.6% |
| Dutch West Indians | 0.0 /100 | #311 | Tragic 21.6% |
| Immigrants | Mexico | 0.0 /100 | #312 | Tragic 21.6% |
| Creek | 0.0 /100 | #313 | Tragic 21.7% |
| Arapaho | 0.0 /100 | #314 | Tragic 21.7% |
| Ute | 0.0 /100 | #315 | Tragic 21.8% |
| Immigrants | Guatemala | 0.0 /100 | #316 | Tragic 21.9% |