Samoan vs Immigrants from Canada Single Father Poverty
COMPARE
Samoan
Immigrants from Canada
Single Father Poverty
Single Father Poverty Comparison
Samoans
Immigrants from Canada
13.8%
SINGLE FATHER POVERTY
100.0/ 100
METRIC RATING
8th/ 347
METRIC RANK
16.5%
SINGLE FATHER POVERTY
21.9/ 100
METRIC RATING
196th/ 347
METRIC RANK
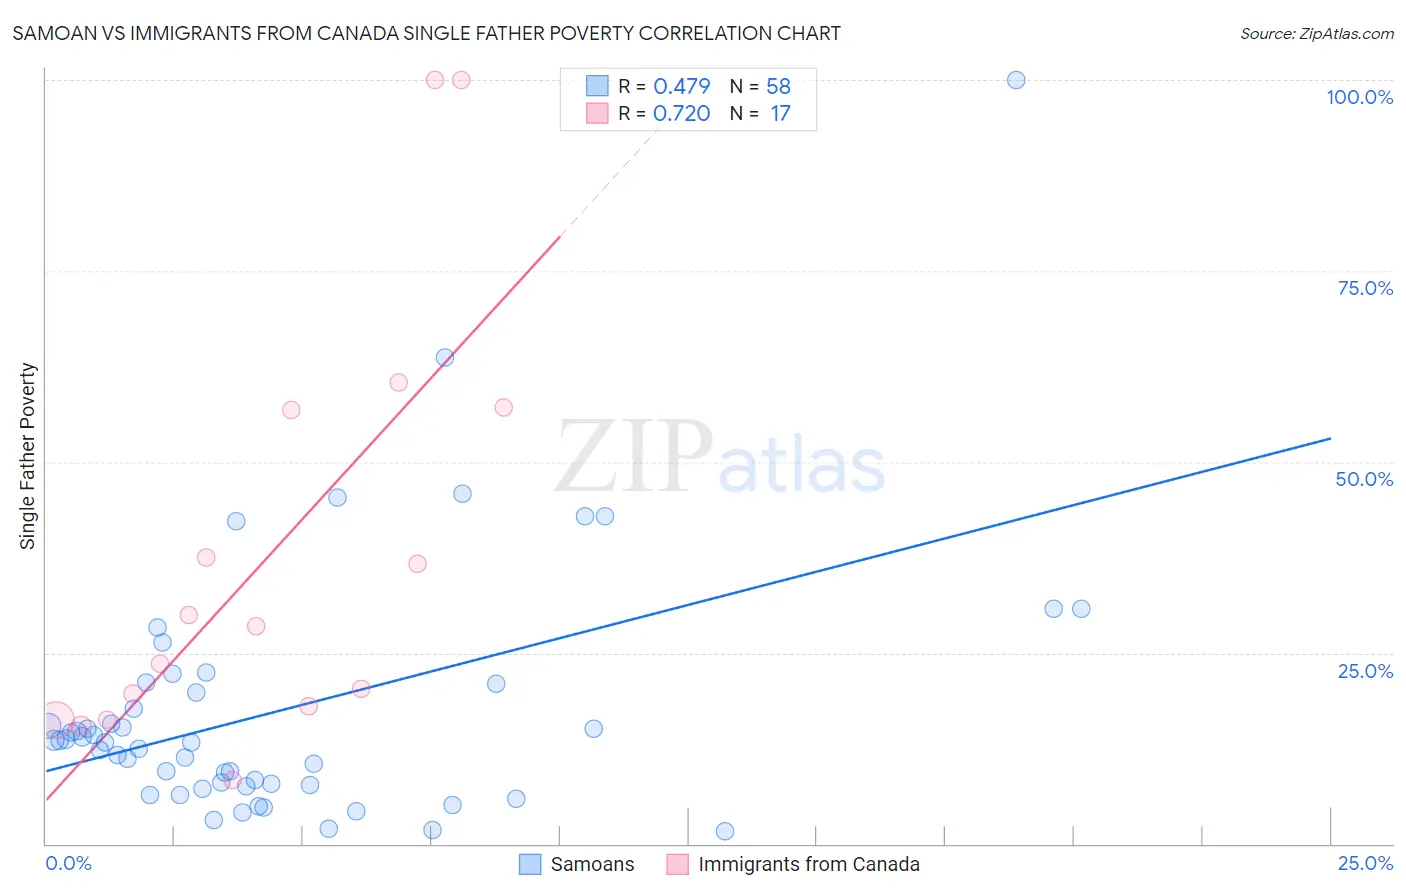
Samoan vs Immigrants from Canada Single Father Poverty Correlation Chart
The statistical analysis conducted on geographies consisting of 195,405,703 people shows a moderate positive correlation between the proportion of Samoans and poverty level among single fathers in the United States with a correlation coefficient (R) of 0.479 and weighted average of 13.8%. Similarly, the statistical analysis conducted on geographies consisting of 347,419,276 people shows a strong positive correlation between the proportion of Immigrants from Canada and poverty level among single fathers in the United States with a correlation coefficient (R) of 0.720 and weighted average of 16.5%, a difference of 19.7%.
Single Father Poverty Correlation Summary
| Measurement | Samoan | Immigrants from Canada |
| Minimum | 1.7% | 8.4% |
| Maximum | 100.0% | 100.0% |
| Range | 98.3% | 91.6% |
| Mean | 17.6% | 37.9% |
| Median | 13.4% | 28.5% |
| Interquartile 25% (IQ1) | 7.7% | 17.1% |
| Interquartile 75% (IQ3) | 20.9% | 57.0% |
| Interquartile Range (IQR) | 13.2% | 39.9% |
| Standard Deviation (Sample) | 16.9% | 28.1% |
| Standard Deviation (Population) | 16.8% | 27.3% |
Similar Demographics by Single Father Poverty
Demographics Similar to Samoans by Single Father Poverty
In terms of single father poverty, the demographic groups most similar to Samoans are Immigrants from Taiwan (13.7%, a difference of 0.86%), Afghan (14.0%, a difference of 1.1%), Korean (14.0%, a difference of 1.2%), Filipino (14.0%, a difference of 1.6%), and Immigrants from India (14.0%, a difference of 1.6%).
| Demographics | Rating | Rank | Single Father Poverty |
| Assyrians/Chaldeans/Syriacs | 100.0 /100 | #1 | Exceptional 11.7% |
| Tongans | 100.0 /100 | #2 | Exceptional 12.2% |
| Tsimshian | 100.0 /100 | #3 | Exceptional 12.7% |
| Immigrants | Fiji | 100.0 /100 | #4 | Exceptional 13.2% |
| Immigrants | Ethiopia | 100.0 /100 | #5 | Exceptional 13.4% |
| Ethiopians | 100.0 /100 | #6 | Exceptional 13.5% |
| Immigrants | Taiwan | 100.0 /100 | #7 | Exceptional 13.7% |
| Samoans | 100.0 /100 | #8 | Exceptional 13.8% |
| Afghans | 100.0 /100 | #9 | Exceptional 14.0% |
| Koreans | 100.0 /100 | #10 | Exceptional 14.0% |
| Filipinos | 100.0 /100 | #11 | Exceptional 14.0% |
| Immigrants | India | 100.0 /100 | #12 | Exceptional 14.0% |
| Immigrants | Philippines | 100.0 /100 | #13 | Exceptional 14.0% |
| Immigrants | Vietnam | 100.0 /100 | #14 | Exceptional 14.1% |
| Sri Lankans | 100.0 /100 | #15 | Exceptional 14.2% |
Demographics Similar to Immigrants from Canada by Single Father Poverty
In terms of single father poverty, the demographic groups most similar to Immigrants from Canada are Immigrants from Northern Europe (16.5%, a difference of 0.11%), Romanian (16.5%, a difference of 0.12%), Immigrants from Belize (16.5%, a difference of 0.14%), Cape Verdean (16.5%, a difference of 0.15%), and Immigrants from Barbados (16.5%, a difference of 0.15%).
| Demographics | Rating | Rank | Single Father Poverty |
| Latvians | 28.9 /100 | #189 | Fair 16.5% |
| Immigrants | Burma/Myanmar | 28.0 /100 | #190 | Fair 16.5% |
| Immigrants | Guyana | 27.1 /100 | #191 | Fair 16.5% |
| Immigrants | Switzerland | 24.8 /100 | #192 | Fair 16.5% |
| Ecuadorians | 24.5 /100 | #193 | Fair 16.5% |
| Cape Verdeans | 24.4 /100 | #194 | Fair 16.5% |
| Immigrants | Barbados | 24.3 /100 | #195 | Fair 16.5% |
| Immigrants | Canada | 21.9 /100 | #196 | Fair 16.5% |
| Immigrants | Northern Europe | 20.3 /100 | #197 | Fair 16.5% |
| Romanians | 20.1 /100 | #198 | Fair 16.5% |
| Immigrants | Belize | 19.8 /100 | #199 | Poor 16.5% |
| Syrians | 17.4 /100 | #200 | Poor 16.6% |
| Cubans | 16.5 /100 | #201 | Poor 16.6% |
| Immigrants | Croatia | 16.5 /100 | #202 | Poor 16.6% |
| Immigrants | North America | 15.1 /100 | #203 | Poor 16.6% |