Romanian vs Immigrants from Venezuela Single Father Poverty
COMPARE
Romanian
Immigrants from Venezuela
Single Father Poverty
Single Father Poverty Comparison
Romanians
Immigrants from Venezuela
16.5%
SINGLE FATHER POVERTY
20.1/ 100
METRIC RATING
198th/ 347
METRIC RANK
16.4%
SINGLE FATHER POVERTY
31.0/ 100
METRIC RATING
186th/ 347
METRIC RANK
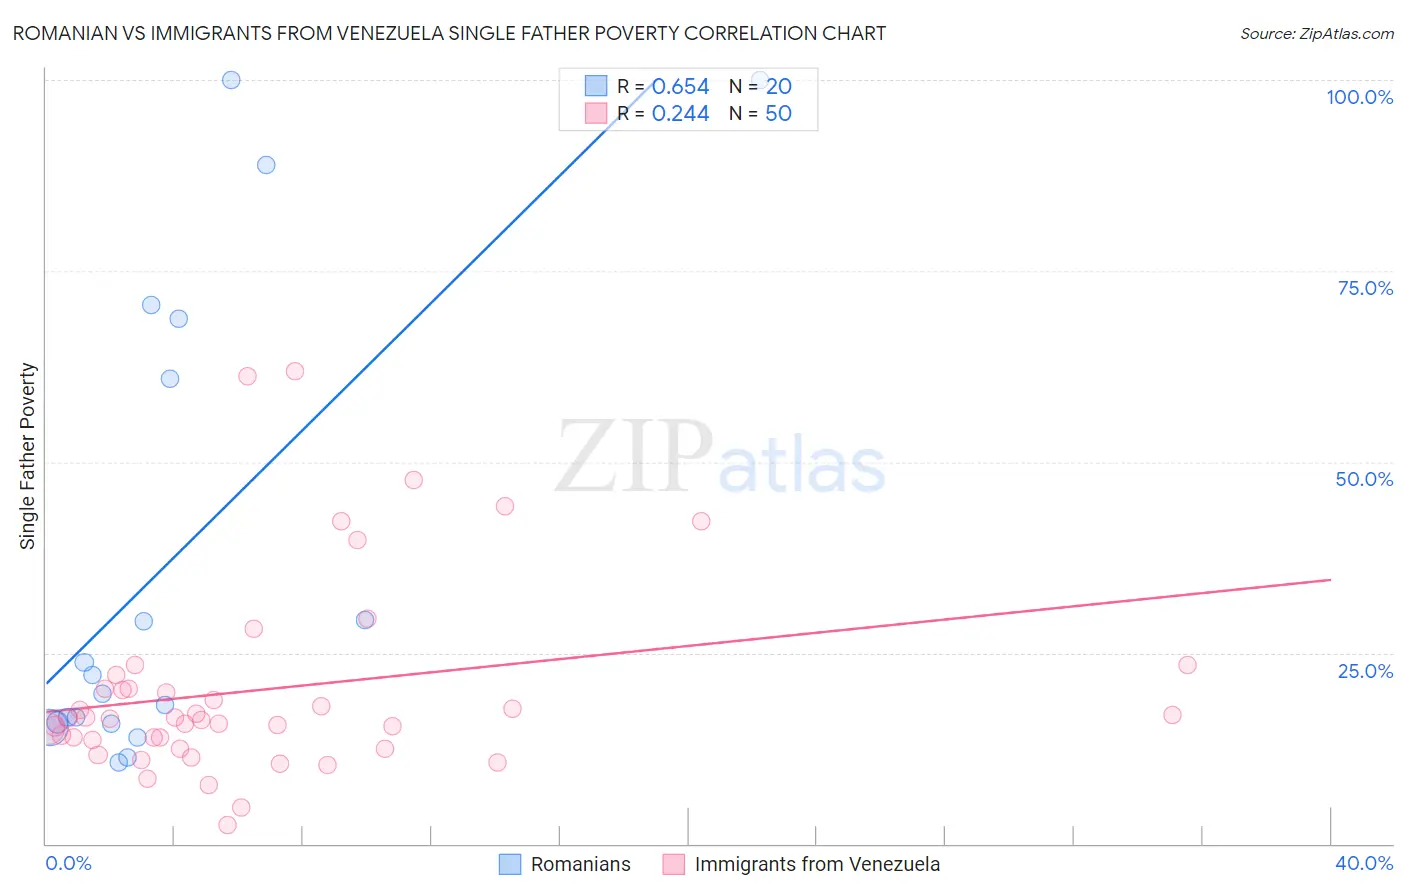
Romanian vs Immigrants from Venezuela Single Father Poverty Correlation Chart
The statistical analysis conducted on geographies consisting of 293,248,867 people shows a significant positive correlation between the proportion of Romanians and poverty level among single fathers in the United States with a correlation coefficient (R) of 0.654 and weighted average of 16.5%. Similarly, the statistical analysis conducted on geographies consisting of 236,867,266 people shows a weak positive correlation between the proportion of Immigrants from Venezuela and poverty level among single fathers in the United States with a correlation coefficient (R) of 0.244 and weighted average of 16.4%, a difference of 0.64%.
Single Father Poverty Correlation Summary
| Measurement | Romanian | Immigrants from Venezuela |
| Minimum | 10.6% | 2.4% |
| Maximum | 100.0% | 61.9% |
| Range | 89.4% | 59.5% |
| Mean | 37.3% | 20.2% |
| Median | 20.9% | 16.4% |
| Interquartile 25% (IQ1) | 15.8% | 13.6% |
| Interquartile 75% (IQ3) | 64.8% | 20.3% |
| Interquartile Range (IQR) | 49.0% | 6.7% |
| Standard Deviation (Sample) | 31.3% | 12.9% |
| Standard Deviation (Population) | 30.5% | 12.8% |
Demographics Similar to Romanians and Immigrants from Venezuela by Single Father Poverty
In terms of single father poverty, the demographic groups most similar to Romanians are Immigrants from Northern Europe (16.5%, a difference of 0.010%), Immigrants from Belize (16.5%, a difference of 0.020%), Immigrants from Canada (16.5%, a difference of 0.12%), Syrian (16.6%, a difference of 0.19%), and Cuban (16.6%, a difference of 0.26%). Similarly, the demographic groups most similar to Immigrants from Venezuela are Ukrainian (16.4%, a difference of 0.030%), Russian (16.4%, a difference of 0.050%), Latvian (16.5%, a difference of 0.11%), Panamanian (16.4%, a difference of 0.13%), and Immigrants from Burma/Myanmar (16.5%, a difference of 0.16%).
| Demographics | Rating | Rank | Single Father Poverty |
| Immigrants | Italy | 35.7 /100 | #182 | Fair 16.4% |
| Aleuts | 35.3 /100 | #183 | Fair 16.4% |
| Cambodians | 34.6 /100 | #184 | Fair 16.4% |
| Panamanians | 33.6 /100 | #185 | Fair 16.4% |
| Immigrants | Venezuela | 31.0 /100 | #186 | Fair 16.4% |
| Ukrainians | 30.4 /100 | #187 | Fair 16.4% |
| Russians | 30.1 /100 | #188 | Fair 16.4% |
| Latvians | 28.9 /100 | #189 | Fair 16.5% |
| Immigrants | Burma/Myanmar | 28.0 /100 | #190 | Fair 16.5% |
| Immigrants | Guyana | 27.1 /100 | #191 | Fair 16.5% |
| Immigrants | Switzerland | 24.8 /100 | #192 | Fair 16.5% |
| Ecuadorians | 24.5 /100 | #193 | Fair 16.5% |
| Cape Verdeans | 24.4 /100 | #194 | Fair 16.5% |
| Immigrants | Barbados | 24.3 /100 | #195 | Fair 16.5% |
| Immigrants | Canada | 21.9 /100 | #196 | Fair 16.5% |
| Immigrants | Northern Europe | 20.3 /100 | #197 | Fair 16.5% |
| Romanians | 20.1 /100 | #198 | Fair 16.5% |
| Immigrants | Belize | 19.8 /100 | #199 | Poor 16.5% |
| Syrians | 17.4 /100 | #200 | Poor 16.6% |
| Cubans | 16.5 /100 | #201 | Poor 16.6% |
| Immigrants | Croatia | 16.5 /100 | #202 | Poor 16.6% |