Puget Sound Salish vs Immigrants from Iran Median Family Income
COMPARE
Puget Sound Salish
Immigrants from Iran
Median Family Income
Median Family Income Comparison
Puget Sound Salish
Immigrants from Iran
$97,958
MEDIAN FAMILY INCOME
8.2/ 100
METRIC RATING
210th/ 347
METRIC RANK
$130,894
MEDIAN FAMILY INCOME
100.0/ 100
METRIC RATING
8th/ 347
METRIC RANK
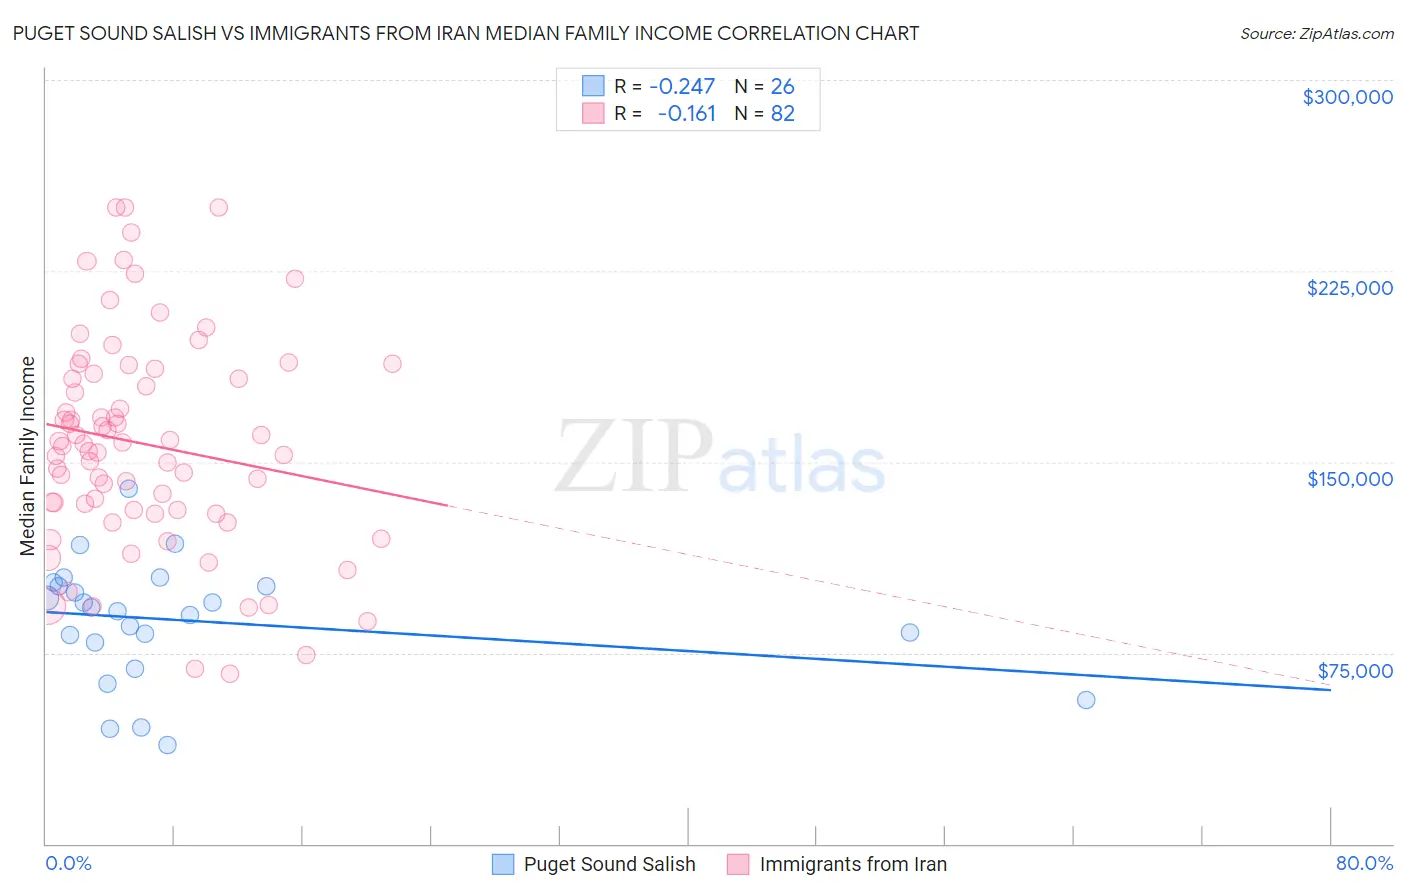
Puget Sound Salish vs Immigrants from Iran Median Family Income Correlation Chart
The statistical analysis conducted on geographies consisting of 46,154,605 people shows a weak negative correlation between the proportion of Puget Sound Salish and median family income in the United States with a correlation coefficient (R) of -0.247 and weighted average of $97,958. Similarly, the statistical analysis conducted on geographies consisting of 279,798,585 people shows a poor negative correlation between the proportion of Immigrants from Iran and median family income in the United States with a correlation coefficient (R) of -0.161 and weighted average of $130,894, a difference of 33.6%.
Median Family Income Correlation Summary
| Measurement | Puget Sound Salish | Immigrants from Iran |
| Minimum | $38,786 | $66,897 |
| Maximum | $139,583 | $250,001 |
| Range | $100,797 | $183,104 |
| Mean | $87,625 | $156,930 |
| Median | $92,122 | $156,641 |
| Interquartile 25% (IQ1) | $79,101 | $131,095 |
| Interquartile 75% (IQ3) | $101,382 | $184,731 |
| Interquartile Range (IQR) | $22,281 | $53,637 |
| Standard Deviation (Sample) | $23,723 | $42,072 |
| Standard Deviation (Population) | $23,263 | $41,815 |
Similar Demographics by Median Family Income
Demographics Similar to Puget Sound Salish by Median Family Income
In terms of median family income, the demographic groups most similar to Puget Sound Salish are Immigrants from Colombia ($98,067, a difference of 0.11%), Immigrants from Sudan ($97,737, a difference of 0.23%), Immigrants from Uruguay ($98,205, a difference of 0.25%), Panamanian ($97,683, a difference of 0.28%), and Immigrants from Armenia ($97,605, a difference of 0.36%).
| Demographics | Rating | Rank | Median Family Income |
| Scotch-Irish | 17.1 /100 | #203 | Poor $99,591 |
| Ghanaians | 12.6 /100 | #204 | Poor $98,877 |
| Hawaiians | 12.5 /100 | #205 | Poor $98,869 |
| Immigrants | Iraq | 12.1 /100 | #206 | Poor $98,786 |
| Aleuts | 11.6 /100 | #207 | Poor $98,702 |
| Immigrants | Uruguay | 9.2 /100 | #208 | Tragic $98,205 |
| Immigrants | Colombia | 8.7 /100 | #209 | Tragic $98,067 |
| Puget Sound Salish | 8.2 /100 | #210 | Tragic $97,958 |
| Immigrants | Sudan | 7.4 /100 | #211 | Tragic $97,737 |
| Panamanians | 7.2 /100 | #212 | Tragic $97,683 |
| Immigrants | Armenia | 7.0 /100 | #213 | Tragic $97,605 |
| Bermudans | 6.9 /100 | #214 | Tragic $97,577 |
| Nigerians | 6.7 /100 | #215 | Tragic $97,522 |
| Immigrants | Bosnia and Herzegovina | 6.4 /100 | #216 | Tragic $97,432 |
| Japanese | 6.0 /100 | #217 | Tragic $97,288 |
Demographics Similar to Immigrants from Iran by Median Family Income
In terms of median family income, the demographic groups most similar to Immigrants from Iran are Immigrants from Hong Kong ($131,067, a difference of 0.13%), Thai ($131,281, a difference of 0.30%), Okinawan ($129,979, a difference of 0.70%), Iranian ($133,839, a difference of 2.2%), and Immigrants from India ($134,028, a difference of 2.4%).
| Demographics | Rating | Rank | Median Family Income |
| Filipinos | 100.0 /100 | #1 | Exceptional $138,397 |
| Immigrants | Taiwan | 100.0 /100 | #2 | Exceptional $136,949 |
| Immigrants | Singapore | 100.0 /100 | #3 | Exceptional $134,818 |
| Immigrants | India | 100.0 /100 | #4 | Exceptional $134,028 |
| Iranians | 100.0 /100 | #5 | Exceptional $133,839 |
| Thais | 100.0 /100 | #6 | Exceptional $131,281 |
| Immigrants | Hong Kong | 100.0 /100 | #7 | Exceptional $131,067 |
| Immigrants | Iran | 100.0 /100 | #8 | Exceptional $130,894 |
| Okinawans | 100.0 /100 | #9 | Exceptional $129,979 |
| Immigrants | Ireland | 100.0 /100 | #10 | Exceptional $127,584 |
| Immigrants | Israel | 100.0 /100 | #11 | Exceptional $127,430 |
| Cypriots | 100.0 /100 | #12 | Exceptional $127,064 |
| Immigrants | Australia | 100.0 /100 | #13 | Exceptional $126,620 |
| Immigrants | South Central Asia | 100.0 /100 | #14 | Exceptional $125,956 |
| Eastern Europeans | 100.0 /100 | #15 | Exceptional $125,546 |