Puget Sound Salish vs Australian Single Male Poverty
COMPARE
Puget Sound Salish
Australian
Single Male Poverty
Single Male Poverty Comparison
Puget Sound Salish
Australians
12.8%
SINGLE MALE POVERTY
54.3/ 100
METRIC RATING
169th/ 347
METRIC RANK
12.6%
SINGLE MALE POVERTY
71.4/ 100
METRIC RATING
152nd/ 347
METRIC RANK
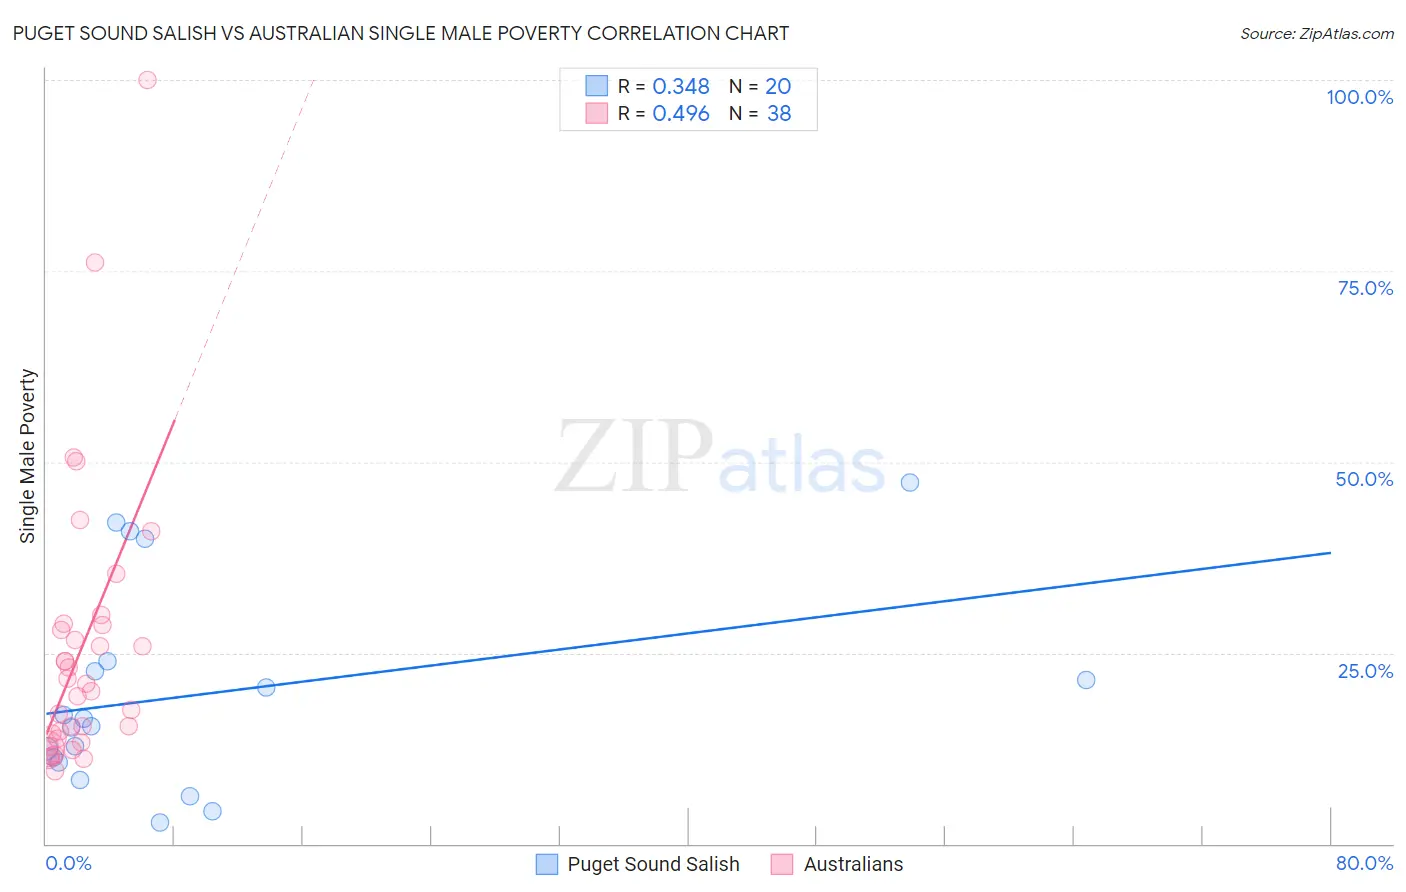
Puget Sound Salish vs Australian Single Male Poverty Correlation Chart
The statistical analysis conducted on geographies consisting of 44,306,636 people shows a mild positive correlation between the proportion of Puget Sound Salish and poverty level among single males in the United States with a correlation coefficient (R) of 0.348 and weighted average of 12.8%. Similarly, the statistical analysis conducted on geographies consisting of 203,982,275 people shows a moderate positive correlation between the proportion of Australians and poverty level among single males in the United States with a correlation coefficient (R) of 0.496 and weighted average of 12.6%, a difference of 0.99%.
Single Male Poverty Correlation Summary
| Measurement | Puget Sound Salish | Australian |
| Minimum | 2.8% | 9.6% |
| Maximum | 47.4% | 100.0% |
| Range | 44.6% | 90.4% |
| Mean | 19.6% | 25.6% |
| Median | 15.9% | 20.5% |
| Interquartile 25% (IQ1) | 10.9% | 13.8% |
| Interquartile 75% (IQ3) | 23.3% | 28.6% |
| Interquartile Range (IQR) | 12.4% | 14.7% |
| Standard Deviation (Sample) | 13.2% | 18.5% |
| Standard Deviation (Population) | 12.9% | 18.3% |
Demographics Similar to Puget Sound Salish and Australians by Single Male Poverty
In terms of single male poverty, the demographic groups most similar to Puget Sound Salish are Guyanese (12.8%, a difference of 0.12%), Immigrants from Barbados (12.7%, a difference of 0.18%), Immigrants from Sudan (12.7%, a difference of 0.21%), Immigrants from Guyana (12.7%, a difference of 0.34%), and Immigrants from Cambodia (12.7%, a difference of 0.43%). Similarly, the demographic groups most similar to Australians are Immigrants from Hungary (12.6%, a difference of 0.030%), Immigrants from Panama (12.6%, a difference of 0.050%), Immigrants (12.7%, a difference of 0.080%), Immigrants from Scotland (12.7%, a difference of 0.16%), and Immigrants from Spain (12.7%, a difference of 0.17%).
| Demographics | Rating | Rank | Single Male Poverty |
| Immigrants | Panama | 72.1 /100 | #150 | Good 12.6% |
| Immigrants | Hungary | 71.9 /100 | #151 | Good 12.6% |
| Australians | 71.4 /100 | #152 | Good 12.6% |
| Immigrants | Immigrants | 70.1 /100 | #153 | Good 12.7% |
| Immigrants | Scotland | 68.9 /100 | #154 | Good 12.7% |
| Immigrants | Spain | 68.7 /100 | #155 | Good 12.7% |
| Vietnamese | 67.9 /100 | #156 | Good 12.7% |
| Latvians | 67.9 /100 | #157 | Good 12.7% |
| Immigrants | Middle Africa | 64.9 /100 | #158 | Good 12.7% |
| Immigrants | Liberia | 64.2 /100 | #159 | Good 12.7% |
| Greeks | 64.1 /100 | #160 | Good 12.7% |
| Immigrants | Africa | 63.4 /100 | #161 | Good 12.7% |
| Eastern Europeans | 63.3 /100 | #162 | Good 12.7% |
| Palestinians | 63.1 /100 | #163 | Good 12.7% |
| Immigrants | Nigeria | 62.8 /100 | #164 | Good 12.7% |
| Immigrants | Cambodia | 62.2 /100 | #165 | Good 12.7% |
| Immigrants | Guyana | 60.5 /100 | #166 | Good 12.7% |
| Immigrants | Sudan | 58.2 /100 | #167 | Average 12.7% |
| Immigrants | Barbados | 57.7 /100 | #168 | Average 12.7% |
| Puget Sound Salish | 54.3 /100 | #169 | Average 12.8% |
| Guyanese | 52.0 /100 | #170 | Average 12.8% |