Immigrants from Liberia vs Honduran Family Poverty
COMPARE
Immigrants from Liberia
Honduran
Family Poverty
Family Poverty Comparison
Immigrants from Liberia
Hondurans
10.8%
FAMILY POVERTY
0.2/ 100
METRIC RATING
255th/ 347
METRIC RANK
12.4%
FAMILY POVERTY
0.0/ 100
METRIC RATING
316th/ 347
METRIC RANK
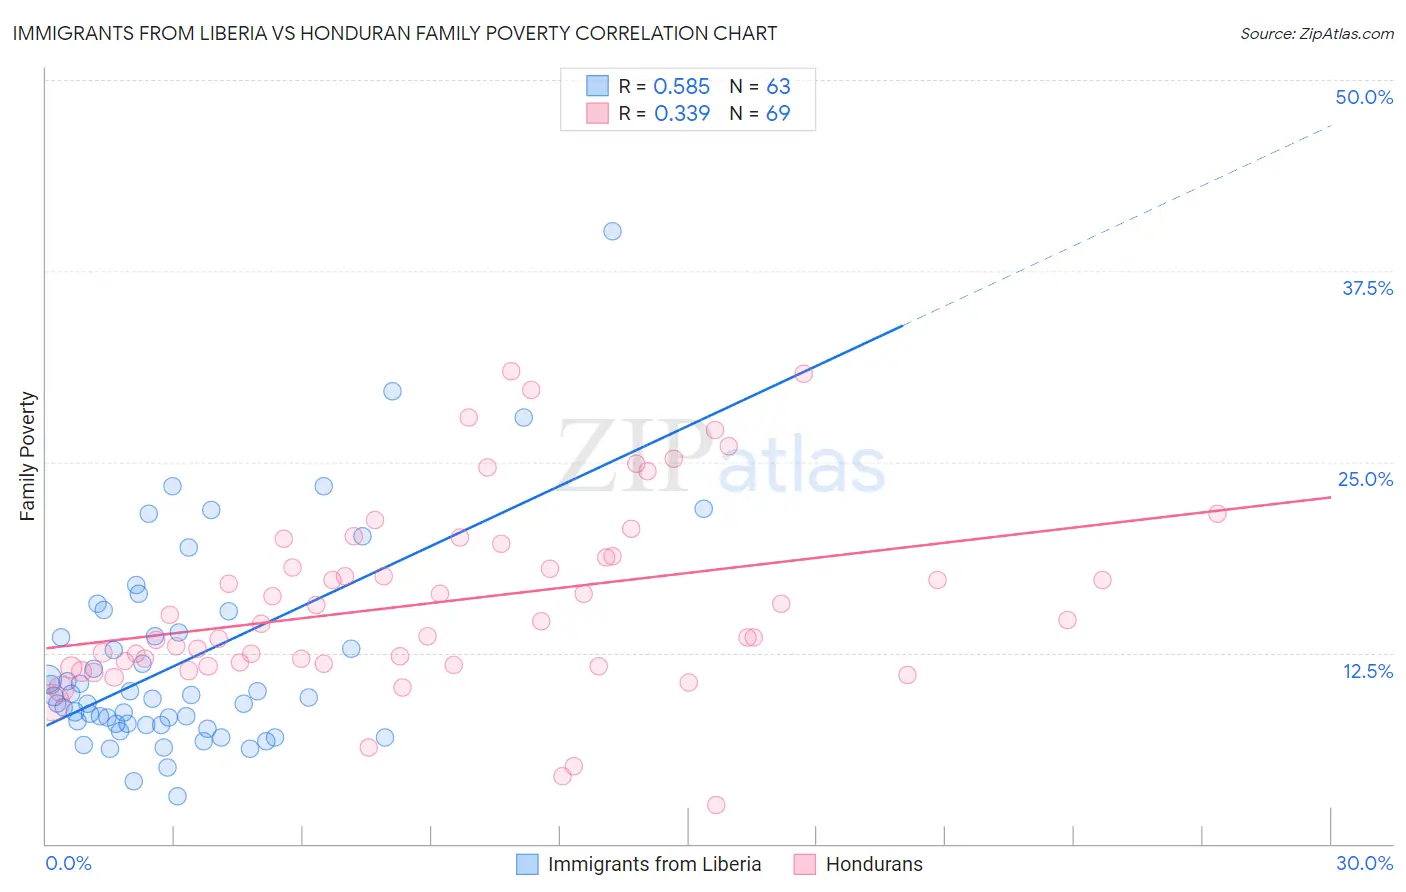
Immigrants from Liberia vs Honduran Family Poverty Correlation Chart
The statistical analysis conducted on geographies consisting of 135,184,573 people shows a substantial positive correlation between the proportion of Immigrants from Liberia and poverty level among families in the United States with a correlation coefficient (R) of 0.585 and weighted average of 10.8%. Similarly, the statistical analysis conducted on geographies consisting of 357,202,991 people shows a mild positive correlation between the proportion of Hondurans and poverty level among families in the United States with a correlation coefficient (R) of 0.339 and weighted average of 12.4%, a difference of 14.3%.
Family Poverty Correlation Summary
| Measurement | Immigrants from Liberia | Honduran |
| Minimum | 3.1% | 2.5% |
| Maximum | 40.1% | 31.0% |
| Range | 37.0% | 28.4% |
| Mean | 11.9% | 15.9% |
| Median | 9.6% | 14.6% |
| Interquartile 25% (IQ1) | 7.8% | 11.7% |
| Interquartile 75% (IQ3) | 13.8% | 19.2% |
| Interquartile Range (IQR) | 6.0% | 7.5% |
| Standard Deviation (Sample) | 6.8% | 6.1% |
| Standard Deviation (Population) | 6.7% | 6.1% |
Similar Demographics by Family Poverty
Demographics Similar to Immigrants from Liberia by Family Poverty
In terms of family poverty, the demographic groups most similar to Immigrants from Liberia are Chickasaw (10.8%, a difference of 0.26%), Immigrants from Ghana (10.8%, a difference of 0.30%), Subsaharan African (10.9%, a difference of 0.34%), Ecuadorian (10.8%, a difference of 0.37%), and Mexican American Indian (10.9%, a difference of 0.38%).
| Demographics | Rating | Rank | Family Poverty |
| Nicaraguans | 0.4 /100 | #248 | Tragic 10.6% |
| Cubans | 0.4 /100 | #249 | Tragic 10.6% |
| Salvadorans | 0.3 /100 | #250 | Tragic 10.7% |
| Iroquois | 0.3 /100 | #251 | Tragic 10.7% |
| Immigrants | Zaire | 0.3 /100 | #252 | Tragic 10.7% |
| Immigrants | Western Africa | 0.3 /100 | #253 | Tragic 10.7% |
| Ecuadorians | 0.2 /100 | #254 | Tragic 10.8% |
| Immigrants | Liberia | 0.2 /100 | #255 | Tragic 10.8% |
| Chickasaw | 0.2 /100 | #256 | Tragic 10.8% |
| Immigrants | Ghana | 0.2 /100 | #257 | Tragic 10.8% |
| Sub-Saharan Africans | 0.2 /100 | #258 | Tragic 10.9% |
| Mexican American Indians | 0.2 /100 | #259 | Tragic 10.9% |
| Bangladeshis | 0.2 /100 | #260 | Tragic 10.9% |
| Shoshone | 0.2 /100 | #261 | Tragic 10.9% |
| Spanish American Indians | 0.2 /100 | #262 | Tragic 10.9% |
Demographics Similar to Hondurans by Family Poverty
In terms of family poverty, the demographic groups most similar to Hondurans are Immigrants from Grenada (12.4%, a difference of 0.22%), U.S. Virgin Islander (12.4%, a difference of 0.22%), British West Indian (12.4%, a difference of 0.27%), Immigrants from Mexico (12.3%, a difference of 0.74%), and Inupiat (12.5%, a difference of 0.76%).
| Demographics | Rating | Rank | Family Poverty |
| Hispanics or Latinos | 0.0 /100 | #309 | Tragic 12.0% |
| Immigrants | Guatemala | 0.0 /100 | #310 | Tragic 12.0% |
| Ute | 0.0 /100 | #311 | Tragic 12.1% |
| Immigrants | Central America | 0.0 /100 | #312 | Tragic 12.1% |
| Immigrants | Caribbean | 0.0 /100 | #313 | Tragic 12.2% |
| Kiowa | 0.0 /100 | #314 | Tragic 12.2% |
| Immigrants | Mexico | 0.0 /100 | #315 | Tragic 12.3% |
| Hondurans | 0.0 /100 | #316 | Tragic 12.4% |
| Immigrants | Grenada | 0.0 /100 | #317 | Tragic 12.4% |
| U.S. Virgin Islanders | 0.0 /100 | #318 | Tragic 12.4% |
| British West Indians | 0.0 /100 | #319 | Tragic 12.4% |
| Inupiat | 0.0 /100 | #320 | Tragic 12.5% |
| Arapaho | 0.0 /100 | #321 | Tragic 12.7% |
| Immigrants | Honduras | 0.0 /100 | #322 | Tragic 12.7% |
| Menominee | 0.0 /100 | #323 | Tragic 12.7% |