Puerto Rican vs Immigrants from Armenia Female Poverty Among 25-34 Year Olds
COMPARE
Puerto Rican
Immigrants from Armenia
Female Poverty Among 25-34 Year Olds
Female Poverty Among 25-34 Year Olds Comparison
Puerto Ricans
Immigrants from Armenia
26.3%
FEMALE POVERTY AMONG 25-34 YEAR OLDS
0.0/ 100
METRIC RATING
347th/ 347
METRIC RANK
12.6%
FEMALE POVERTY AMONG 25-34 YEAR OLDS
96.9/ 100
METRIC RATING
92nd/ 347
METRIC RANK
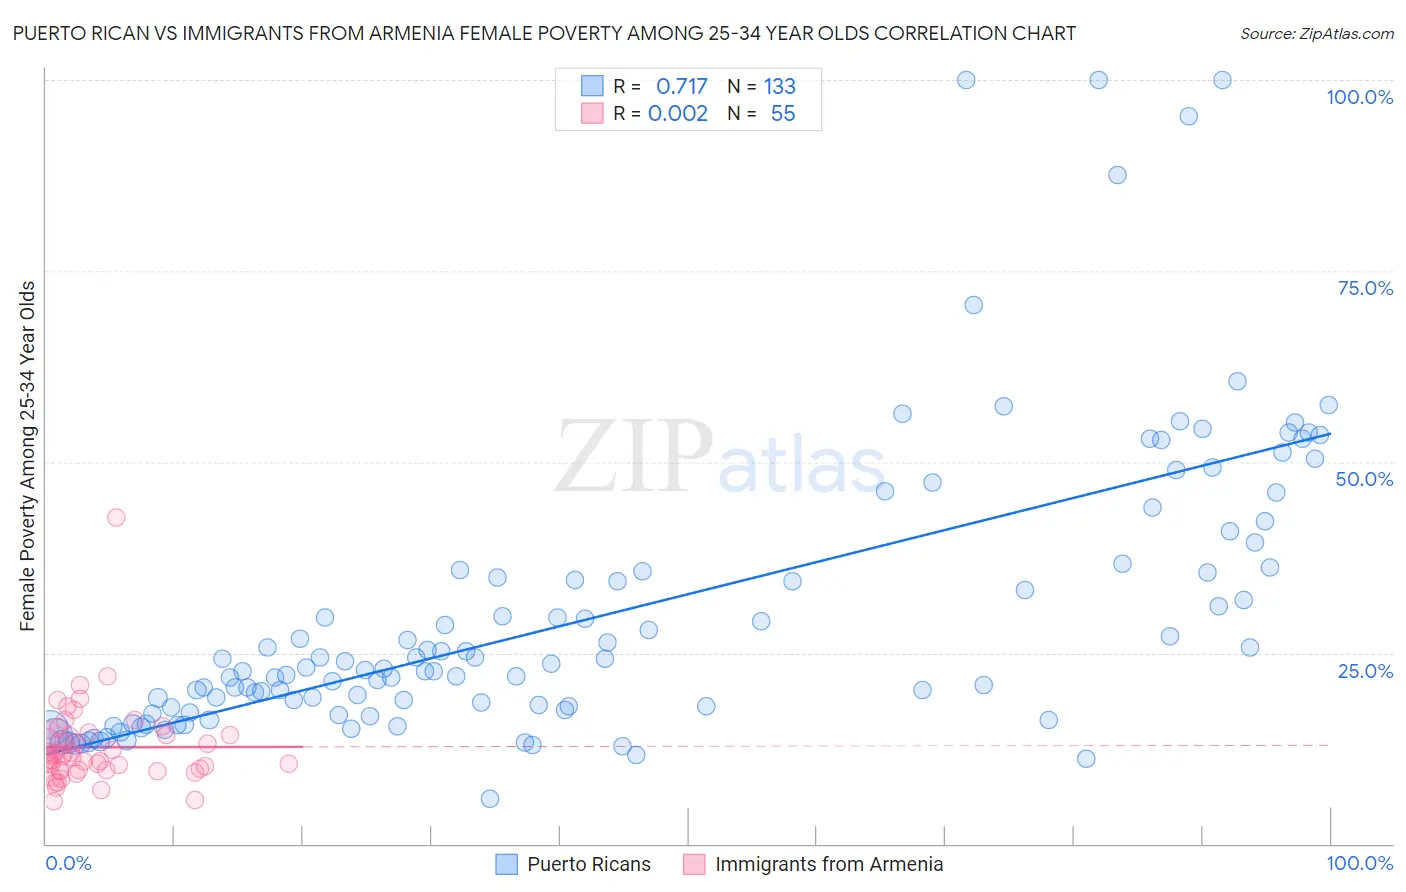
Puerto Rican vs Immigrants from Armenia Female Poverty Among 25-34 Year Olds Correlation Chart
The statistical analysis conducted on geographies consisting of 514,481,871 people shows a strong positive correlation between the proportion of Puerto Ricans and poverty level among females between the ages 25 and 34 in the United States with a correlation coefficient (R) of 0.717 and weighted average of 26.3%. Similarly, the statistical analysis conducted on geographies consisting of 97,252,675 people shows no correlation between the proportion of Immigrants from Armenia and poverty level among females between the ages 25 and 34 in the United States with a correlation coefficient (R) of 0.002 and weighted average of 12.6%, a difference of 109.2%.
Female Poverty Among 25-34 Year Olds Correlation Summary
| Measurement | Puerto Rican | Immigrants from Armenia |
| Minimum | 6.0% | 5.6% |
| Maximum | 100.0% | 42.7% |
| Range | 94.0% | 37.1% |
| Mean | 30.0% | 12.6% |
| Median | 22.9% | 11.5% |
| Interquartile 25% (IQ1) | 17.3% | 9.7% |
| Interquartile 75% (IQ3) | 35.8% | 14.2% |
| Interquartile Range (IQR) | 18.5% | 4.5% |
| Standard Deviation (Sample) | 19.0% | 5.4% |
| Standard Deviation (Population) | 18.9% | 5.4% |
Similar Demographics by Female Poverty Among 25-34 Year Olds
Demographics Similar to Puerto Ricans by Female Poverty Among 25-34 Year Olds
In terms of female poverty among 25-34 year olds, the demographic groups most similar to Puerto Ricans are Lumbee (26.3%, a difference of 0.030%), Pima (25.3%, a difference of 3.9%), Tohono O'odham (24.7%, a difference of 6.2%), Yup'ik (24.3%, a difference of 8.1%), and Hopi (23.7%, a difference of 11.0%).
| Demographics | Rating | Rank | Female Poverty Among 25-34 Year Olds |
| Cajuns | 0.0 /100 | #333 | Tragic 19.9% |
| Apache | 0.0 /100 | #334 | Tragic 20.1% |
| Natives/Alaskans | 0.0 /100 | #335 | Tragic 20.3% |
| Pueblo | 0.0 /100 | #336 | Tragic 22.2% |
| Crow | 0.0 /100 | #337 | Tragic 22.7% |
| Houma | 0.0 /100 | #338 | Tragic 22.7% |
| Yuman | 0.0 /100 | #339 | Tragic 22.9% |
| Sioux | 0.0 /100 | #340 | Tragic 23.0% |
| Navajo | 0.0 /100 | #341 | Tragic 23.3% |
| Hopi | 0.0 /100 | #342 | Tragic 23.7% |
| Yup'ik | 0.0 /100 | #343 | Tragic 24.3% |
| Tohono O'odham | 0.0 /100 | #344 | Tragic 24.7% |
| Pima | 0.0 /100 | #345 | Tragic 25.3% |
| Lumbee | 0.0 /100 | #346 | Tragic 26.3% |
| Puerto Ricans | 0.0 /100 | #347 | Tragic 26.3% |
Demographics Similar to Immigrants from Armenia by Female Poverty Among 25-34 Year Olds
In terms of female poverty among 25-34 year olds, the demographic groups most similar to Immigrants from Armenia are Norwegian (12.6%, a difference of 0.010%), Palestinian (12.6%, a difference of 0.030%), Immigrants from France (12.6%, a difference of 0.090%), Immigrants from Albania (12.5%, a difference of 0.11%), and Ukrainian (12.6%, a difference of 0.12%).
| Demographics | Rating | Rank | Female Poverty Among 25-34 Year Olds |
| Immigrants | South Eastern Asia | 97.6 /100 | #85 | Exceptional 12.5% |
| Croatians | 97.5 /100 | #86 | Exceptional 12.5% |
| Argentineans | 97.5 /100 | #87 | Exceptional 12.5% |
| Immigrants | Austria | 97.4 /100 | #88 | Exceptional 12.5% |
| Italians | 97.2 /100 | #89 | Exceptional 12.5% |
| Immigrants | Albania | 97.1 /100 | #90 | Exceptional 12.5% |
| Norwegians | 96.9 /100 | #91 | Exceptional 12.6% |
| Immigrants | Armenia | 96.9 /100 | #92 | Exceptional 12.6% |
| Palestinians | 96.9 /100 | #93 | Exceptional 12.6% |
| Immigrants | France | 96.8 /100 | #94 | Exceptional 12.6% |
| Ukrainians | 96.7 /100 | #95 | Exceptional 12.6% |
| Immigrants | Zimbabwe | 96.7 /100 | #96 | Exceptional 12.6% |
| Immigrants | Northern Africa | 96.6 /100 | #97 | Exceptional 12.6% |
| Immigrants | Ethiopia | 96.5 /100 | #98 | Exceptional 12.6% |
| Immigrants | Argentina | 96.4 /100 | #99 | Exceptional 12.6% |