Pueblo vs Immigrants from Denmark Median Family Income
COMPARE
Pueblo
Immigrants from Denmark
Median Family Income
Median Family Income Comparison
Pueblo
Immigrants from Denmark
$76,880
MEDIAN FAMILY INCOME
0.0/ 100
METRIC RATING
341st/ 347
METRIC RANK
$120,445
MEDIAN FAMILY INCOME
100.0/ 100
METRIC RATING
28th/ 347
METRIC RANK
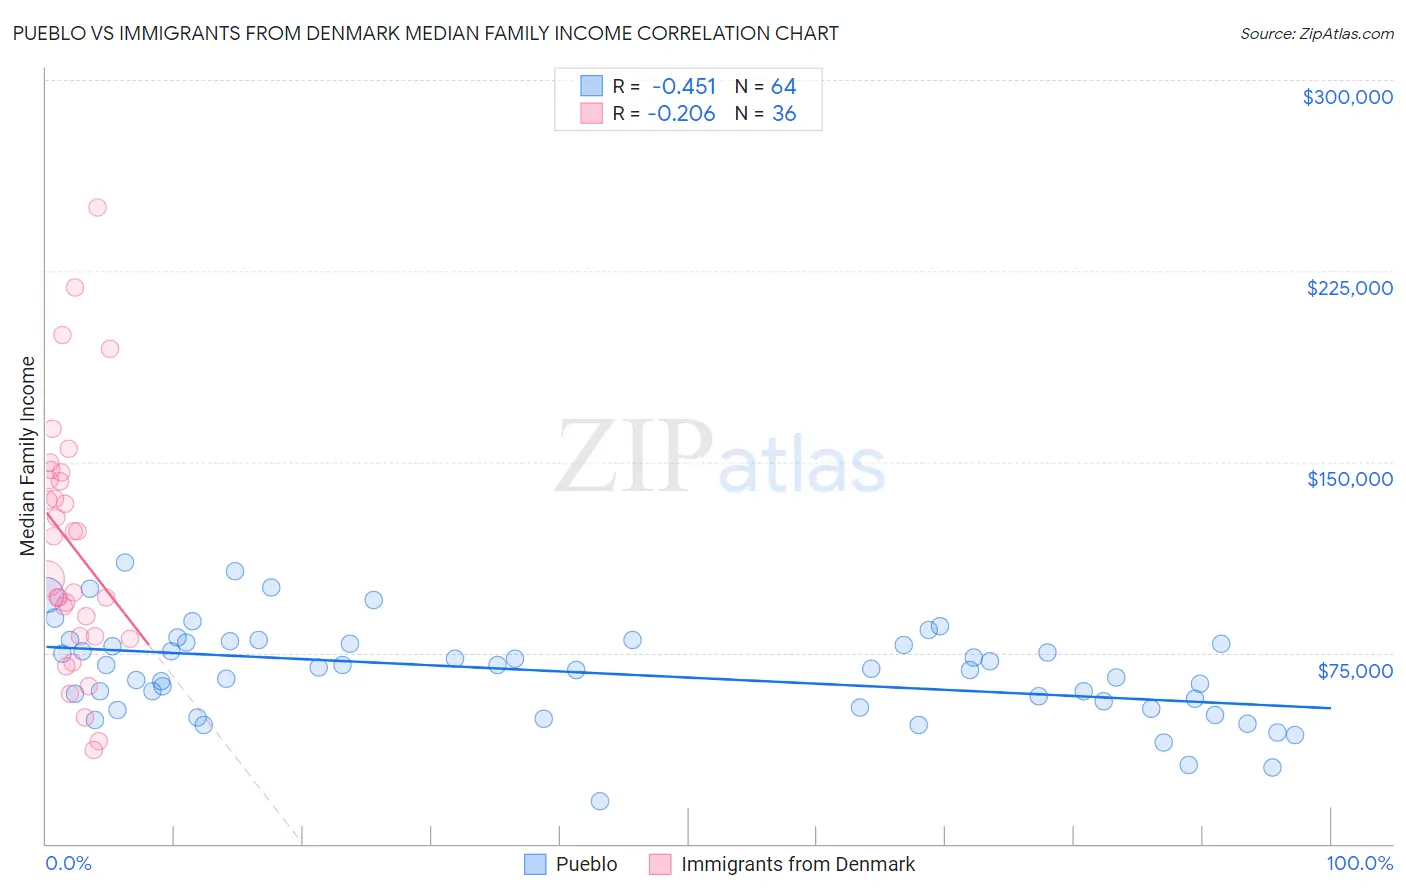
Pueblo vs Immigrants from Denmark Median Family Income Correlation Chart
The statistical analysis conducted on geographies consisting of 120,047,767 people shows a moderate negative correlation between the proportion of Pueblo and median family income in the United States with a correlation coefficient (R) of -0.451 and weighted average of $76,880. Similarly, the statistical analysis conducted on geographies consisting of 136,397,640 people shows a weak negative correlation between the proportion of Immigrants from Denmark and median family income in the United States with a correlation coefficient (R) of -0.206 and weighted average of $120,445, a difference of 56.7%.
Median Family Income Correlation Summary
| Measurement | Pueblo | Immigrants from Denmark |
| Minimum | $16,806 | $36,611 |
| Maximum | $110,375 | $250,001 |
| Range | $93,569 | $213,390 |
| Mean | $67,508 | $116,902 |
| Median | $68,832 | $112,401 |
| Interquartile 25% (IQ1) | $54,583 | $81,504 |
| Interquartile 75% (IQ3) | $78,820 | $144,309 |
| Interquartile Range (IQR) | $24,237 | $62,805 |
| Standard Deviation (Sample) | $18,534 | $49,223 |
| Standard Deviation (Population) | $18,389 | $48,535 |
Similar Demographics by Median Family Income
Demographics Similar to Pueblo by Median Family Income
In terms of median family income, the demographic groups most similar to Pueblo are Crow ($76,605, a difference of 0.36%), Hopi ($77,188, a difference of 0.40%), Pima ($77,431, a difference of 0.72%), Immigrants from Yemen ($77,457, a difference of 0.75%), and Houma ($76,188, a difference of 0.91%).
| Demographics | Rating | Rank | Median Family Income |
| Kiowa | 0.0 /100 | #333 | Tragic $80,885 |
| Menominee | 0.0 /100 | #334 | Tragic $79,563 |
| Yup'ik | 0.0 /100 | #335 | Tragic $79,290 |
| Immigrants | Cuba | 0.0 /100 | #336 | Tragic $78,249 |
| Yuman | 0.0 /100 | #337 | Tragic $78,055 |
| Immigrants | Yemen | 0.0 /100 | #338 | Tragic $77,457 |
| Pima | 0.0 /100 | #339 | Tragic $77,431 |
| Hopi | 0.0 /100 | #340 | Tragic $77,188 |
| Pueblo | 0.0 /100 | #341 | Tragic $76,880 |
| Crow | 0.0 /100 | #342 | Tragic $76,605 |
| Houma | 0.0 /100 | #343 | Tragic $76,188 |
| Tohono O'odham | 0.0 /100 | #344 | Tragic $72,193 |
| Navajo | 0.0 /100 | #345 | Tragic $70,989 |
| Puerto Ricans | 0.0 /100 | #346 | Tragic $70,423 |
| Lumbee | 0.0 /100 | #347 | Tragic $68,679 |
Demographics Similar to Immigrants from Denmark by Median Family Income
In terms of median family income, the demographic groups most similar to Immigrants from Denmark are Russian ($120,487, a difference of 0.040%), Latvian ($120,301, a difference of 0.12%), Immigrants from Sri Lanka ($120,263, a difference of 0.15%), Immigrants from Switzerland ($120,726, a difference of 0.23%), and Immigrants from France ($120,076, a difference of 0.31%).
| Demographics | Rating | Rank | Median Family Income |
| Immigrants | Korea | 100.0 /100 | #21 | Exceptional $122,800 |
| Immigrants | Sweden | 100.0 /100 | #22 | Exceptional $122,765 |
| Immigrants | Japan | 100.0 /100 | #23 | Exceptional $122,764 |
| Immigrants | Northern Europe | 100.0 /100 | #24 | Exceptional $121,840 |
| Turks | 100.0 /100 | #25 | Exceptional $121,202 |
| Immigrants | Switzerland | 100.0 /100 | #26 | Exceptional $120,726 |
| Russians | 100.0 /100 | #27 | Exceptional $120,487 |
| Immigrants | Denmark | 100.0 /100 | #28 | Exceptional $120,445 |
| Latvians | 100.0 /100 | #29 | Exceptional $120,301 |
| Immigrants | Sri Lanka | 100.0 /100 | #30 | Exceptional $120,263 |
| Immigrants | France | 100.0 /100 | #31 | Exceptional $120,076 |
| Asians | 100.0 /100 | #32 | Exceptional $119,955 |
| Bhutanese | 100.0 /100 | #33 | Exceptional $119,800 |
| Bolivians | 100.0 /100 | #34 | Exceptional $119,479 |
| Soviet Union | 100.0 /100 | #35 | Exceptional $119,262 |