Pueblo vs Slovak Female Poverty Among 18-24 Year Olds
COMPARE
Pueblo
Slovak
Female Poverty Among 18-24 Year Olds
Female Poverty Among 18-24 Year Olds Comparison
Pueblo
Slovaks
26.9%
FEMALE POVERTY AMONG 18-24 YEAR OLDS
0.0/ 100
METRIC RATING
334th/ 347
METRIC RANK
19.5%
FEMALE POVERTY AMONG 18-24 YEAR OLDS
92.9/ 100
METRIC RATING
128th/ 347
METRIC RANK
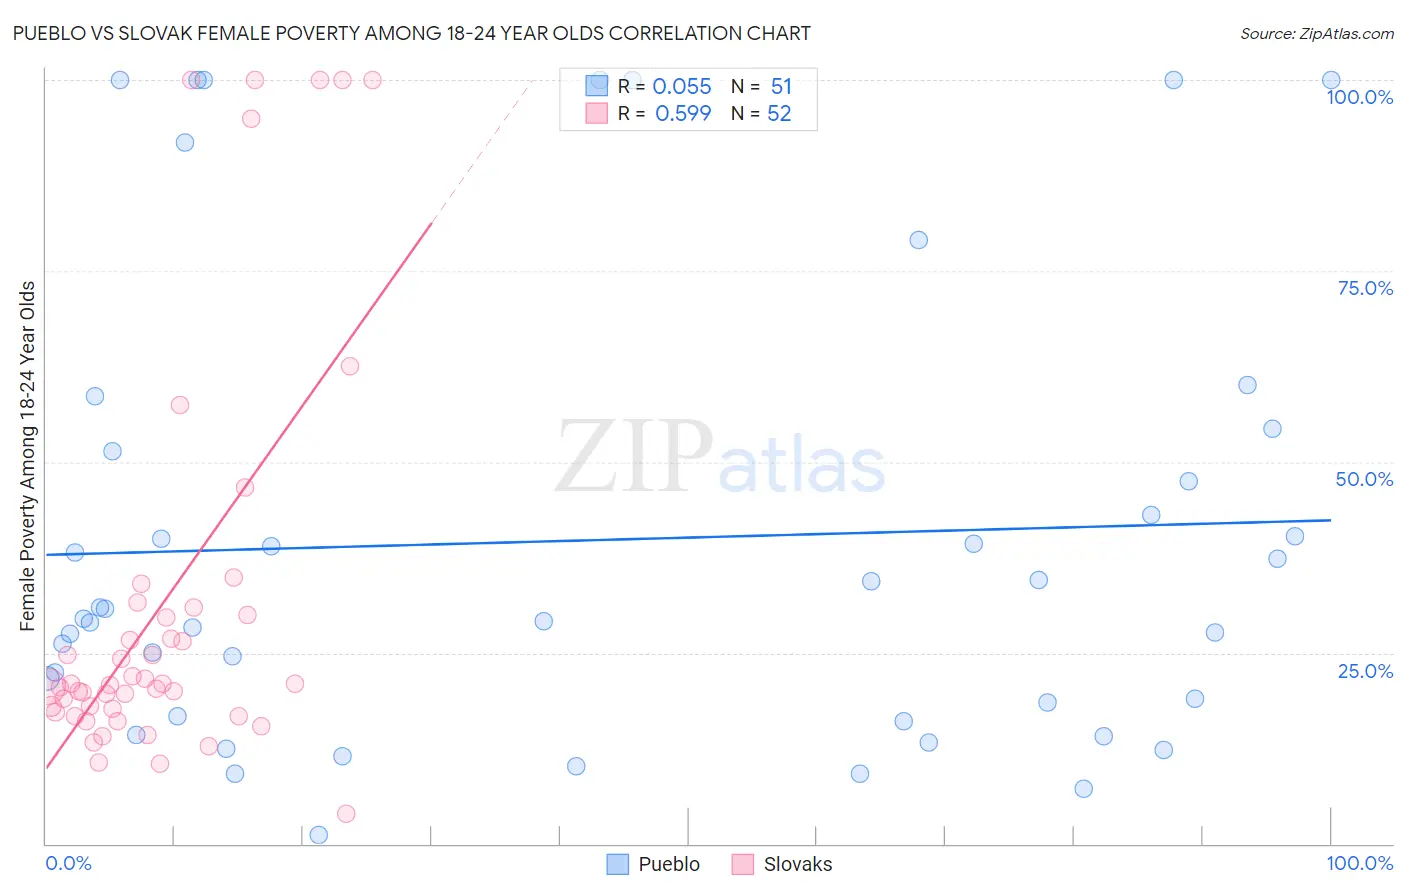
Pueblo vs Slovak Female Poverty Among 18-24 Year Olds Correlation Chart
The statistical analysis conducted on geographies consisting of 119,346,276 people shows a slight positive correlation between the proportion of Pueblo and poverty level among females between the ages 18 and 24 in the United States with a correlation coefficient (R) of 0.055 and weighted average of 26.9%. Similarly, the statistical analysis conducted on geographies consisting of 383,670,122 people shows a substantial positive correlation between the proportion of Slovaks and poverty level among females between the ages 18 and 24 in the United States with a correlation coefficient (R) of 0.599 and weighted average of 19.5%, a difference of 38.2%.
Female Poverty Among 18-24 Year Olds Correlation Summary
| Measurement | Pueblo | Slovak |
| Minimum | 1.1% | 3.9% |
| Maximum | 100.0% | 100.0% |
| Range | 98.9% | 96.1% |
| Mean | 39.7% | 31.6% |
| Median | 29.4% | 20.9% |
| Interquartile 25% (IQ1) | 16.7% | 17.5% |
| Interquartile 75% (IQ3) | 51.5% | 30.5% |
| Interquartile Range (IQR) | 34.8% | 13.0% |
| Standard Deviation (Sample) | 29.9% | 26.7% |
| Standard Deviation (Population) | 29.6% | 26.4% |
Similar Demographics by Female Poverty Among 18-24 Year Olds
Demographics Similar to Pueblo by Female Poverty Among 18-24 Year Olds
In terms of female poverty among 18-24 year olds, the demographic groups most similar to Pueblo are Yup'ik (27.0%, a difference of 0.45%), Apache (26.3%, a difference of 2.2%), Immigrants from Yemen (27.5%, a difference of 2.4%), Houma (26.2%, a difference of 2.8%), and Chippewa (25.9%, a difference of 3.8%).
| Demographics | Rating | Rank | Female Poverty Among 18-24 Year Olds |
| Ute | 0.0 /100 | #327 | Tragic 25.4% |
| Natives/Alaskans | 0.0 /100 | #328 | Tragic 25.4% |
| Cajuns | 0.0 /100 | #329 | Tragic 25.7% |
| Immigrants | Somalia | 0.0 /100 | #330 | Tragic 25.7% |
| Chippewa | 0.0 /100 | #331 | Tragic 25.9% |
| Houma | 0.0 /100 | #332 | Tragic 26.2% |
| Apache | 0.0 /100 | #333 | Tragic 26.3% |
| Pueblo | 0.0 /100 | #334 | Tragic 26.9% |
| Yup'ik | 0.0 /100 | #335 | Tragic 27.0% |
| Immigrants | Yemen | 0.0 /100 | #336 | Tragic 27.5% |
| Cheyenne | 0.0 /100 | #337 | Tragic 28.1% |
| Hopi | 0.0 /100 | #338 | Tragic 28.2% |
| Pima | 0.0 /100 | #339 | Tragic 28.4% |
| Sioux | 0.0 /100 | #340 | Tragic 28.6% |
| Colville | 0.0 /100 | #341 | Tragic 29.0% |
Demographics Similar to Slovaks by Female Poverty Among 18-24 Year Olds
In terms of female poverty among 18-24 year olds, the demographic groups most similar to Slovaks are Immigrants from England (19.5%, a difference of 0.0%), Immigrants from Canada (19.5%, a difference of 0.010%), Latvian (19.5%, a difference of 0.040%), Cape Verdean (19.4%, a difference of 0.13%), and Immigrants from Russia (19.4%, a difference of 0.15%).
| Demographics | Rating | Rank | Female Poverty Among 18-24 Year Olds |
| Guyanese | 95.3 /100 | #121 | Exceptional 19.4% |
| Cambodians | 94.6 /100 | #122 | Exceptional 19.4% |
| Paraguayans | 94.6 /100 | #123 | Exceptional 19.4% |
| Immigrants | Chile | 94.3 /100 | #124 | Exceptional 19.4% |
| Immigrants | Panama | 94.0 /100 | #125 | Exceptional 19.4% |
| Immigrants | Russia | 93.7 /100 | #126 | Exceptional 19.4% |
| Cape Verdeans | 93.6 /100 | #127 | Exceptional 19.4% |
| Slovaks | 92.9 /100 | #128 | Exceptional 19.5% |
| Immigrants | England | 92.9 /100 | #129 | Exceptional 19.5% |
| Immigrants | Canada | 92.9 /100 | #130 | Exceptional 19.5% |
| Latvians | 92.7 /100 | #131 | Exceptional 19.5% |
| Jamaicans | 92.1 /100 | #132 | Exceptional 19.5% |
| Turks | 92.1 /100 | #133 | Exceptional 19.5% |
| Immigrants | North America | 92.1 /100 | #134 | Exceptional 19.5% |
| Soviet Union | 92.0 /100 | #135 | Exceptional 19.5% |