Pueblo vs Icelander Single Male Poverty
COMPARE
Pueblo
Icelander
Single Male Poverty
Single Male Poverty Comparison
Pueblo
Icelanders
21.6%
SINGLE MALE POVERTY
0.0/ 100
METRIC RATING
338th/ 347
METRIC RANK
12.5%
SINGLE MALE POVERTY
88.2/ 100
METRIC RATING
121st/ 347
METRIC RANK
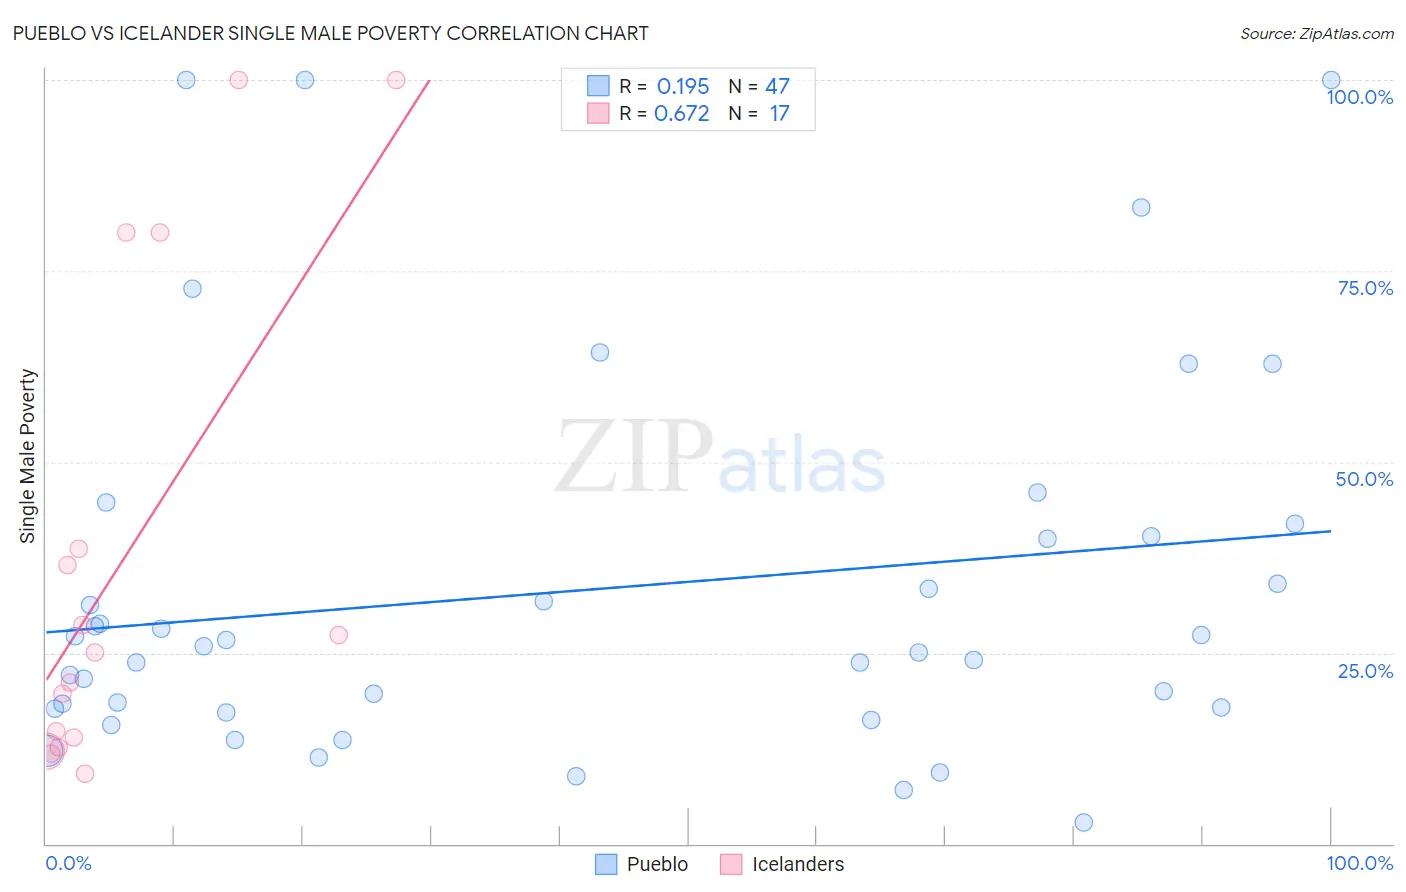
Pueblo vs Icelander Single Male Poverty Correlation Chart
The statistical analysis conducted on geographies consisting of 115,485,335 people shows a poor positive correlation between the proportion of Pueblo and poverty level among single males in the United States with a correlation coefficient (R) of 0.195 and weighted average of 21.6%. Similarly, the statistical analysis conducted on geographies consisting of 148,220,666 people shows a significant positive correlation between the proportion of Icelanders and poverty level among single males in the United States with a correlation coefficient (R) of 0.672 and weighted average of 12.5%, a difference of 73.5%.
Single Male Poverty Correlation Summary
| Measurement | Pueblo | Icelander |
| Minimum | 2.9% | 9.1% |
| Maximum | 100.0% | 100.0% |
| Range | 97.1% | 90.9% |
| Mean | 33.2% | 37.1% |
| Median | 25.9% | 25.0% |
| Interquartile 25% (IQ1) | 17.7% | 13.3% |
| Interquartile 75% (IQ3) | 40.2% | 59.3% |
| Interquartile Range (IQR) | 22.5% | 46.1% |
| Standard Deviation (Sample) | 24.7% | 31.8% |
| Standard Deviation (Population) | 24.4% | 30.8% |
Similar Demographics by Single Male Poverty
Demographics Similar to Pueblo by Single Male Poverty
In terms of single male poverty, the demographic groups most similar to Pueblo are Apache (21.6%, a difference of 0.18%), Tohono O'odham (21.6%, a difference of 0.28%), Yuman (21.3%, a difference of 1.5%), Arapaho (21.9%, a difference of 1.5%), and Sioux (22.2%, a difference of 2.8%).
| Demographics | Rating | Rank | Single Male Poverty |
| Paiute | 0.0 /100 | #331 | Tragic 19.3% |
| Natives/Alaskans | 0.0 /100 | #332 | Tragic 19.6% |
| Inupiat | 0.0 /100 | #333 | Tragic 20.0% |
| Pima | 0.0 /100 | #334 | Tragic 20.2% |
| Yuman | 0.0 /100 | #335 | Tragic 21.3% |
| Tohono O'odham | 0.0 /100 | #336 | Tragic 21.6% |
| Apache | 0.0 /100 | #337 | Tragic 21.6% |
| Pueblo | 0.0 /100 | #338 | Tragic 21.6% |
| Arapaho | 0.0 /100 | #339 | Tragic 21.9% |
| Sioux | 0.0 /100 | #340 | Tragic 22.2% |
| Crow | 0.0 /100 | #341 | Tragic 23.3% |
| Houma | 0.0 /100 | #342 | Tragic 23.5% |
| Puerto Ricans | 0.0 /100 | #343 | Tragic 25.1% |
| Lumbee | 0.0 /100 | #344 | Tragic 25.2% |
| Navajo | 0.0 /100 | #345 | Tragic 25.3% |
Demographics Similar to Icelanders by Single Male Poverty
In terms of single male poverty, the demographic groups most similar to Icelanders are Serbian (12.5%, a difference of 0.050%), Immigrants from Kenya (12.5%, a difference of 0.090%), Russian (12.5%, a difference of 0.12%), Immigrants from Jordan (12.5%, a difference of 0.15%), and Venezuelan (12.4%, a difference of 0.16%).
| Demographics | Rating | Rank | Single Male Poverty |
| Nicaraguans | 92.1 /100 | #114 | Exceptional 12.4% |
| Immigrants | Southern Europe | 91.5 /100 | #115 | Exceptional 12.4% |
| Immigrants | Syria | 91.2 /100 | #116 | Exceptional 12.4% |
| Immigrants | Oceania | 91.1 /100 | #117 | Exceptional 12.4% |
| Albanians | 90.6 /100 | #118 | Exceptional 12.4% |
| Immigrants | Albania | 90.3 /100 | #119 | Exceptional 12.4% |
| Venezuelans | 89.4 /100 | #120 | Excellent 12.4% |
| Icelanders | 88.2 /100 | #121 | Excellent 12.5% |
| Serbians | 87.9 /100 | #122 | Excellent 12.5% |
| Immigrants | Kenya | 87.6 /100 | #123 | Excellent 12.5% |
| Russians | 87.3 /100 | #124 | Excellent 12.5% |
| Immigrants | Jordan | 87.1 /100 | #125 | Excellent 12.5% |
| Romanians | 86.4 /100 | #126 | Excellent 12.5% |
| Immigrants | Netherlands | 86.2 /100 | #127 | Excellent 12.5% |
| Ecuadorians | 85.9 /100 | #128 | Excellent 12.5% |