Pueblo vs Icelander Unemployment Among Ages 25 to 29 years
COMPARE
Pueblo
Icelander
Unemployment Among Ages 25 to 29 years
Unemployment Among Ages 25 to 29 years Comparison
Pueblo
Icelanders
10.4%
UNEMPLOYMENT AMONG AGES 25 TO 29 YEARS
0.0/ 100
METRIC RATING
332nd/ 347
METRIC RANK
6.3%
UNEMPLOYMENT AMONG AGES 25 TO 29 YEARS
96.6/ 100
METRIC RATING
77th/ 347
METRIC RANK
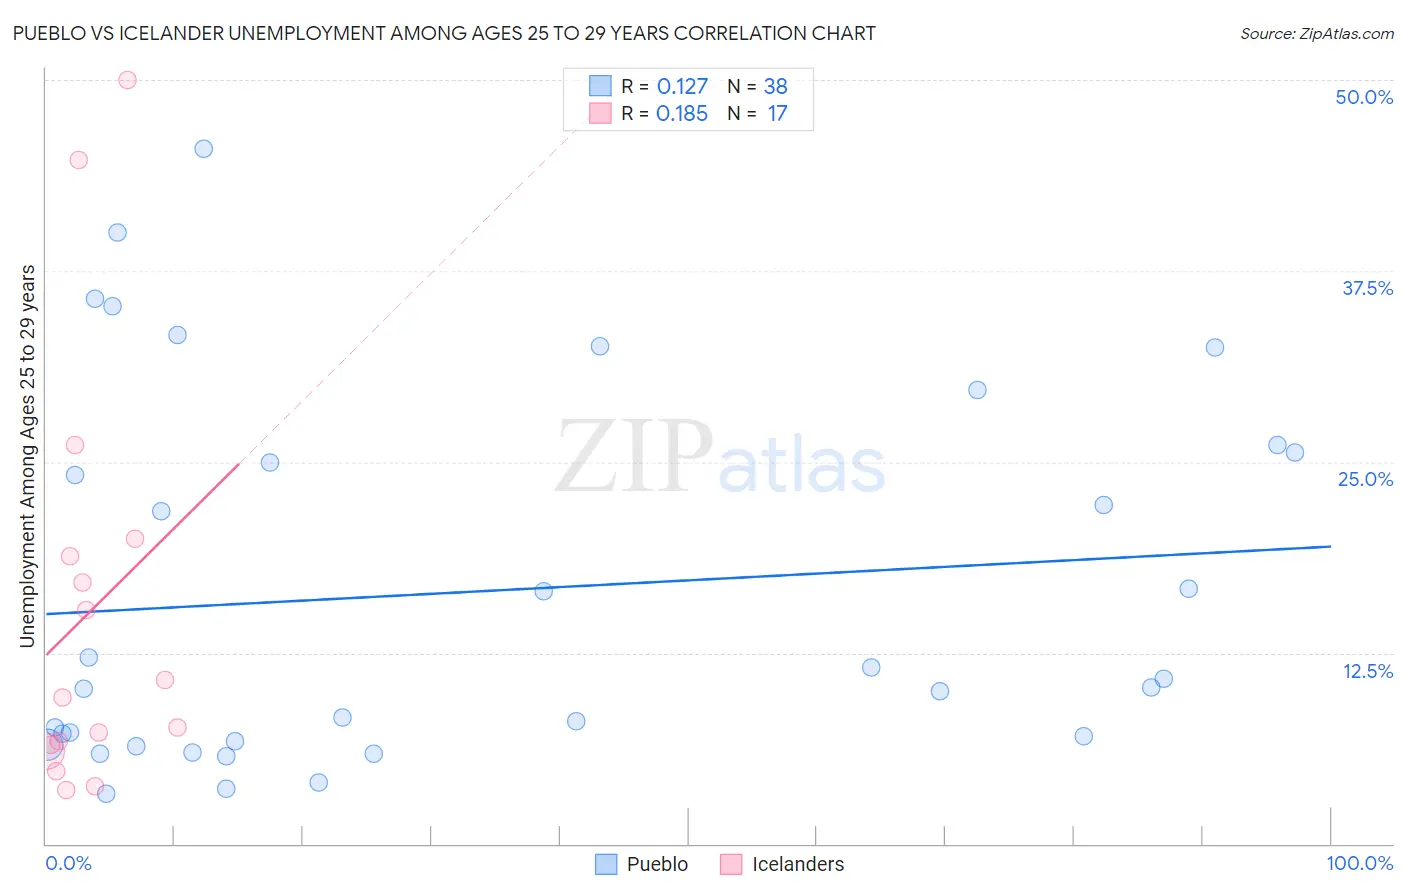
Pueblo vs Icelander Unemployment Among Ages 25 to 29 years Correlation Chart
The statistical analysis conducted on geographies consisting of 118,019,548 people shows a poor positive correlation between the proportion of Pueblo and unemployment rate among population between the ages 25 and 29 in the United States with a correlation coefficient (R) of 0.127 and weighted average of 10.4%. Similarly, the statistical analysis conducted on geographies consisting of 154,630,748 people shows a poor positive correlation between the proportion of Icelanders and unemployment rate among population between the ages 25 and 29 in the United States with a correlation coefficient (R) of 0.185 and weighted average of 6.3%, a difference of 65.5%.
Unemployment Among Ages 25 to 29 years Correlation Summary
| Measurement | Pueblo | Icelander |
| Minimum | 3.2% | 3.5% |
| Maximum | 45.5% | 50.0% |
| Range | 42.3% | 46.5% |
| Mean | 16.5% | 15.2% |
| Median | 10.5% | 9.6% |
| Interquartile 25% (IQ1) | 6.7% | 6.3% |
| Interquartile 75% (IQ3) | 25.6% | 19.4% |
| Interquartile Range (IQR) | 18.9% | 13.1% |
| Standard Deviation (Sample) | 12.1% | 13.7% |
| Standard Deviation (Population) | 11.9% | 13.3% |
Similar Demographics by Unemployment Among Ages 25 to 29 years
Demographics Similar to Pueblo by Unemployment Among Ages 25 to 29 years
In terms of unemployment among ages 25 to 29 years, the demographic groups most similar to Pueblo are Alaska Native (10.2%, a difference of 2.3%), Alaskan Athabascan (10.8%, a difference of 3.4%), Yuman (11.0%, a difference of 5.4%), Native/Alaskan (9.8%, a difference of 6.1%), and Puerto Rican (11.1%, a difference of 6.6%).
| Demographics | Rating | Rank | Unemployment Among Ages 25 to 29 years |
| Yakama | 0.0 /100 | #325 | Tragic 8.8% |
| Shoshone | 0.0 /100 | #326 | Tragic 9.2% |
| Colville | 0.0 /100 | #327 | Tragic 9.2% |
| Apache | 0.0 /100 | #328 | Tragic 9.5% |
| Aleuts | 0.0 /100 | #329 | Tragic 9.7% |
| Natives/Alaskans | 0.0 /100 | #330 | Tragic 9.8% |
| Alaska Natives | 0.0 /100 | #331 | Tragic 10.2% |
| Pueblo | 0.0 /100 | #332 | Tragic 10.4% |
| Alaskan Athabascans | 0.0 /100 | #333 | Tragic 10.8% |
| Yuman | 0.0 /100 | #334 | Tragic 11.0% |
| Puerto Ricans | 0.0 /100 | #335 | Tragic 11.1% |
| Lumbee | 0.0 /100 | #336 | Tragic 11.2% |
| Menominee | 0.0 /100 | #337 | Tragic 11.3% |
| Sioux | 0.0 /100 | #338 | Tragic 11.7% |
| Pima | 0.0 /100 | #339 | Tragic 11.8% |
Demographics Similar to Icelanders by Unemployment Among Ages 25 to 29 years
In terms of unemployment among ages 25 to 29 years, the demographic groups most similar to Icelanders are Immigrants from Korea (6.3%, a difference of 0.020%), Immigrants from Jordan (6.3%, a difference of 0.080%), Asian (6.3%, a difference of 0.10%), Carpatho Rusyn (6.3%, a difference of 0.16%), and Belgian (6.3%, a difference of 0.18%).
| Demographics | Rating | Rank | Unemployment Among Ages 25 to 29 years |
| Immigrants | Malaysia | 97.5 /100 | #70 | Exceptional 6.3% |
| Immigrants | France | 97.4 /100 | #71 | Exceptional 6.3% |
| Scandinavians | 97.4 /100 | #72 | Exceptional 6.3% |
| Belgians | 97.0 /100 | #73 | Exceptional 6.3% |
| Carpatho Rusyns | 96.9 /100 | #74 | Exceptional 6.3% |
| Immigrants | Jordan | 96.8 /100 | #75 | Exceptional 6.3% |
| Immigrants | Korea | 96.7 /100 | #76 | Exceptional 6.3% |
| Icelanders | 96.6 /100 | #77 | Exceptional 6.3% |
| Asians | 96.4 /100 | #78 | Exceptional 6.3% |
| Immigrants | Switzerland | 96.0 /100 | #79 | Exceptional 6.3% |
| Immigrants | Romania | 95.9 /100 | #80 | Exceptional 6.3% |
| Iranians | 95.8 /100 | #81 | Exceptional 6.3% |
| Immigrants | Poland | 95.7 /100 | #82 | Exceptional 6.3% |
| Slovenes | 95.3 /100 | #83 | Exceptional 6.3% |
| Immigrants | Spain | 95.2 /100 | #84 | Exceptional 6.3% |