Polish vs Immigrants from Guyana Child Poverty Under the Age of 5
COMPARE
Polish
Immigrants from Guyana
Child Poverty Under the Age of 5
Child Poverty Under the Age of 5 Comparison
Poles
Immigrants from Guyana
15.7%
CHILD POVERTY UNDER THE AGE OF 5
97.2/ 100
METRIC RATING
91st/ 347
METRIC RANK
19.6%
CHILD POVERTY UNDER THE AGE OF 5
0.5/ 100
METRIC RATING
242nd/ 347
METRIC RANK
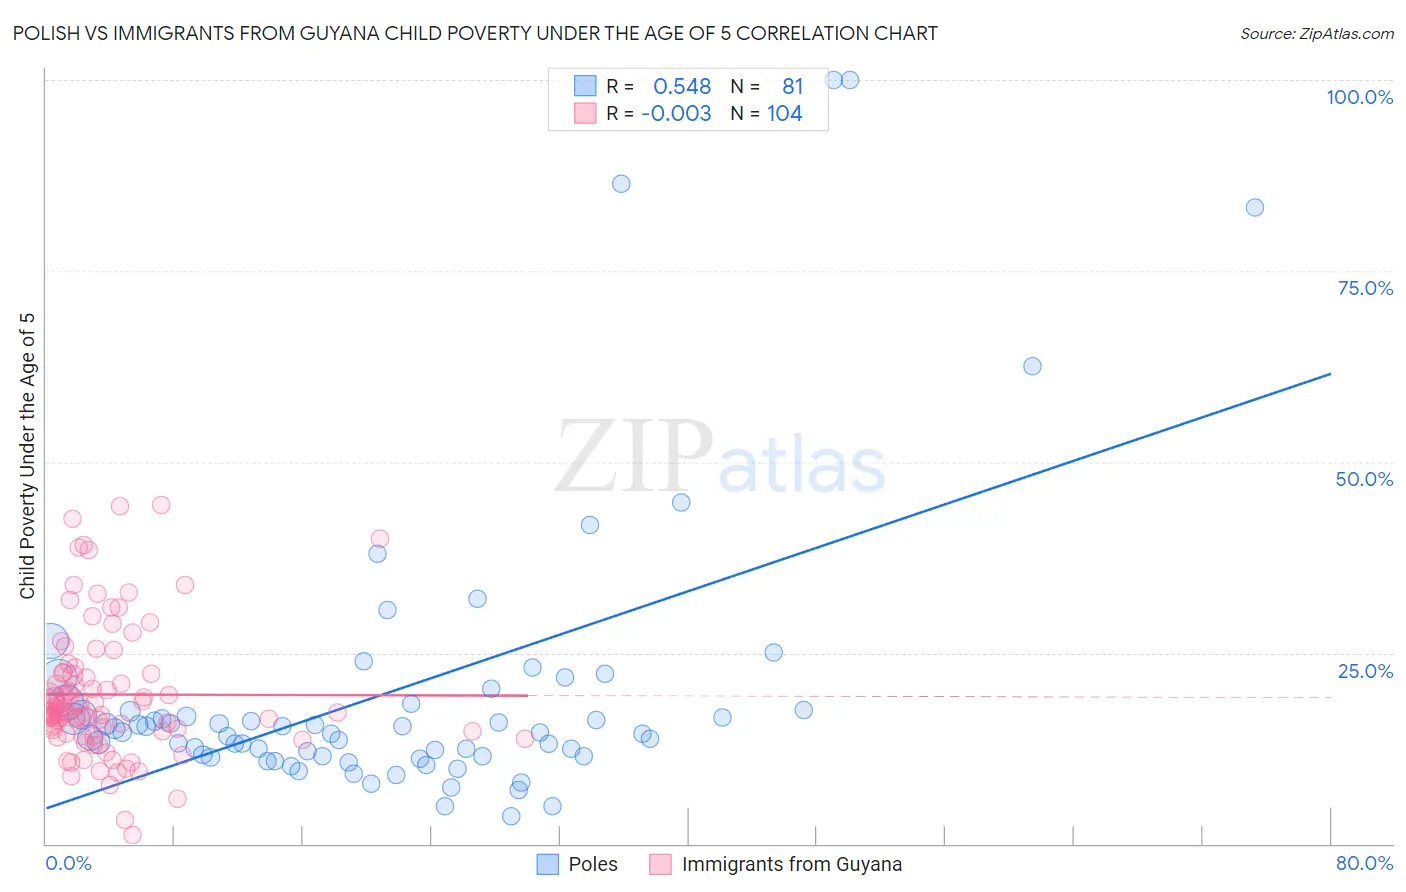
Polish vs Immigrants from Guyana Child Poverty Under the Age of 5 Correlation Chart
The statistical analysis conducted on geographies consisting of 520,801,927 people shows a substantial positive correlation between the proportion of Poles and poverty level among children under the age of 5 in the United States with a correlation coefficient (R) of 0.548 and weighted average of 15.7%. Similarly, the statistical analysis conducted on geographies consisting of 179,217,429 people shows no correlation between the proportion of Immigrants from Guyana and poverty level among children under the age of 5 in the United States with a correlation coefficient (R) of -0.003 and weighted average of 19.6%, a difference of 25.3%.
Child Poverty Under the Age of 5 Correlation Summary
| Measurement | Polish | Immigrants from Guyana |
| Minimum | 3.7% | 1.1% |
| Maximum | 100.0% | 44.4% |
| Range | 96.3% | 43.2% |
| Mean | 20.0% | 19.5% |
| Median | 14.6% | 17.2% |
| Interquartile 25% (IQ1) | 11.5% | 14.7% |
| Interquartile 75% (IQ3) | 17.9% | 22.3% |
| Interquartile Range (IQR) | 6.4% | 7.6% |
| Standard Deviation (Sample) | 18.9% | 8.6% |
| Standard Deviation (Population) | 18.8% | 8.6% |
Similar Demographics by Child Poverty Under the Age of 5
Demographics Similar to Poles by Child Poverty Under the Age of 5
In terms of child poverty under the age of 5, the demographic groups most similar to Poles are Scandinavian (15.7%, a difference of 0.060%), Ukrainian (15.7%, a difference of 0.090%), Immigrants from South Eastern Asia (15.7%, a difference of 0.10%), Immigrants from Croatia (15.6%, a difference of 0.11%), and Immigrants from France (15.6%, a difference of 0.11%).
| Demographics | Rating | Rank | Child Poverty Under the Age of 5 |
| Immigrants | Netherlands | 97.6 /100 | #84 | Exceptional 15.6% |
| Immigrants | Latvia | 97.4 /100 | #85 | Exceptional 15.6% |
| Immigrants | Malaysia | 97.4 /100 | #86 | Exceptional 15.6% |
| Immigrants | Vietnam | 97.4 /100 | #87 | Exceptional 15.6% |
| Jordanians | 97.3 /100 | #88 | Exceptional 15.6% |
| Immigrants | Croatia | 97.3 /100 | #89 | Exceptional 15.6% |
| Immigrants | France | 97.3 /100 | #90 | Exceptional 15.6% |
| Poles | 97.2 /100 | #91 | Exceptional 15.7% |
| Scandinavians | 97.1 /100 | #92 | Exceptional 15.7% |
| Ukrainians | 97.1 /100 | #93 | Exceptional 15.7% |
| Immigrants | South Eastern Asia | 97.1 /100 | #94 | Exceptional 15.7% |
| Immigrants | Switzerland | 96.4 /100 | #95 | Exceptional 15.8% |
| Immigrants | Kazakhstan | 96.2 /100 | #96 | Exceptional 15.8% |
| Macedonians | 96.2 /100 | #97 | Exceptional 15.8% |
| Immigrants | South Africa | 96.1 /100 | #98 | Exceptional 15.8% |
Demographics Similar to Immigrants from Guyana by Child Poverty Under the Age of 5
In terms of child poverty under the age of 5, the demographic groups most similar to Immigrants from Guyana are Osage (19.6%, a difference of 0.10%), Alaska Native (19.6%, a difference of 0.11%), Immigrants from Ghana (19.6%, a difference of 0.12%), Immigrants from Ecuador (19.6%, a difference of 0.18%), and Immigrants from Western Africa (19.7%, a difference of 0.31%).
| Demographics | Rating | Rank | Child Poverty Under the Age of 5 |
| Immigrants | Laos | 0.8 /100 | #235 | Tragic 19.4% |
| Immigrants | Trinidad and Tobago | 0.8 /100 | #236 | Tragic 19.4% |
| Immigrants | Cabo Verde | 0.6 /100 | #237 | Tragic 19.5% |
| Salvadorans | 0.6 /100 | #238 | Tragic 19.5% |
| Vietnamese | 0.6 /100 | #239 | Tragic 19.5% |
| Immigrants | Ecuador | 0.5 /100 | #240 | Tragic 19.6% |
| Alaska Natives | 0.5 /100 | #241 | Tragic 19.6% |
| Immigrants | Guyana | 0.5 /100 | #242 | Tragic 19.6% |
| Osage | 0.5 /100 | #243 | Tragic 19.6% |
| Immigrants | Ghana | 0.5 /100 | #244 | Tragic 19.6% |
| Immigrants | Western Africa | 0.4 /100 | #245 | Tragic 19.7% |
| Cree | 0.4 /100 | #246 | Tragic 19.7% |
| Guyanese | 0.4 /100 | #247 | Tragic 19.7% |
| Marshallese | 0.4 /100 | #248 | Tragic 19.7% |
| Immigrants | Middle Africa | 0.4 /100 | #249 | Tragic 19.7% |