West Indian vs Immigrants from Guyana Child Poverty Under the Age of 5
COMPARE
West Indian
Immigrants from Guyana
Child Poverty Under the Age of 5
Child Poverty Under the Age of 5 Comparison
West Indians
Immigrants from Guyana
20.6%
CHILD POVERTY UNDER THE AGE OF 5
0.0/ 100
METRIC RATING
276th/ 347
METRIC RANK
19.6%
CHILD POVERTY UNDER THE AGE OF 5
0.5/ 100
METRIC RATING
242nd/ 347
METRIC RANK
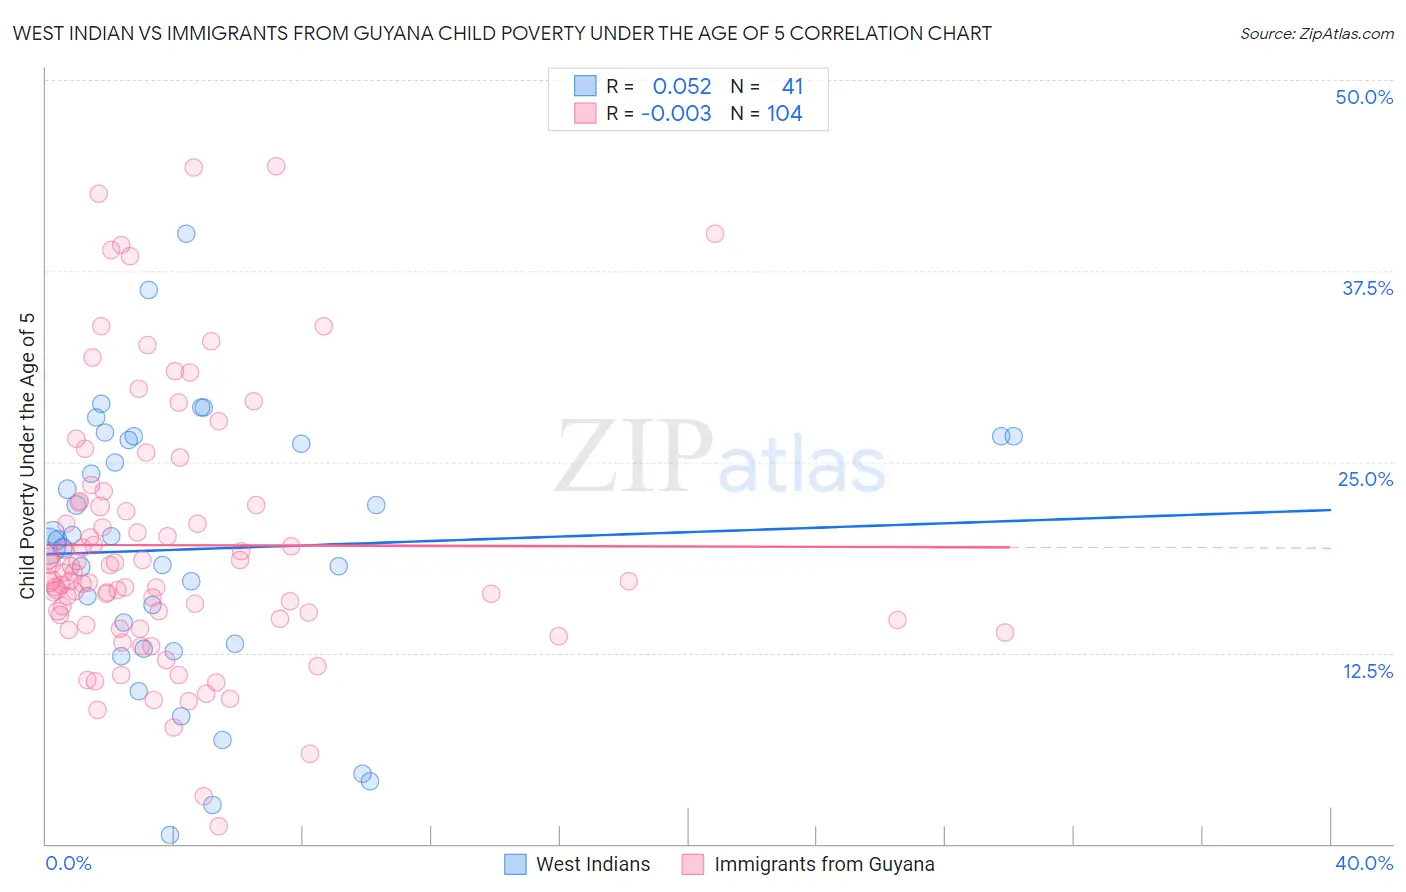
West Indian vs Immigrants from Guyana Child Poverty Under the Age of 5 Correlation Chart
The statistical analysis conducted on geographies consisting of 248,219,785 people shows a slight positive correlation between the proportion of West Indians and poverty level among children under the age of 5 in the United States with a correlation coefficient (R) of 0.052 and weighted average of 20.6%. Similarly, the statistical analysis conducted on geographies consisting of 179,217,429 people shows no correlation between the proportion of Immigrants from Guyana and poverty level among children under the age of 5 in the United States with a correlation coefficient (R) of -0.003 and weighted average of 19.6%, a difference of 5.2%.
Child Poverty Under the Age of 5 Correlation Summary
| Measurement | West Indian | Immigrants from Guyana |
| Minimum | 0.55% | 1.1% |
| Maximum | 40.0% | 44.4% |
| Range | 39.4% | 43.2% |
| Mean | 19.3% | 19.5% |
| Median | 19.9% | 17.2% |
| Interquartile 25% (IQ1) | 12.9% | 14.7% |
| Interquartile 75% (IQ3) | 26.6% | 22.3% |
| Interquartile Range (IQR) | 13.6% | 7.6% |
| Standard Deviation (Sample) | 8.9% | 8.6% |
| Standard Deviation (Population) | 8.7% | 8.6% |
Similar Demographics by Child Poverty Under the Age of 5
Demographics Similar to West Indians by Child Poverty Under the Age of 5
In terms of child poverty under the age of 5, the demographic groups most similar to West Indians are Bangladeshi (20.6%, a difference of 0.090%), Immigrants from Belize (20.6%, a difference of 0.14%), Immigrants from West Indies (20.7%, a difference of 0.17%), Immigrants from Grenada (20.7%, a difference of 0.19%), and Central American (20.6%, a difference of 0.24%).
| Demographics | Rating | Rank | Child Poverty Under the Age of 5 |
| Immigrants | Burma/Myanmar | 0.1 /100 | #269 | Tragic 20.4% |
| Jamaicans | 0.1 /100 | #270 | Tragic 20.4% |
| Americans | 0.1 /100 | #271 | Tragic 20.5% |
| Immigrants | Jamaica | 0.1 /100 | #272 | Tragic 20.5% |
| Central Americans | 0.1 /100 | #273 | Tragic 20.6% |
| Immigrants | Belize | 0.1 /100 | #274 | Tragic 20.6% |
| Bangladeshis | 0.1 /100 | #275 | Tragic 20.6% |
| West Indians | 0.0 /100 | #276 | Tragic 20.6% |
| Immigrants | West Indies | 0.0 /100 | #277 | Tragic 20.7% |
| Immigrants | Grenada | 0.0 /100 | #278 | Tragic 20.7% |
| Sub-Saharan Africans | 0.0 /100 | #279 | Tragic 20.8% |
| French American Indians | 0.0 /100 | #280 | Tragic 20.8% |
| Senegalese | 0.0 /100 | #281 | Tragic 20.9% |
| Potawatomi | 0.0 /100 | #282 | Tragic 21.0% |
| Comanche | 0.0 /100 | #283 | Tragic 21.0% |
Demographics Similar to Immigrants from Guyana by Child Poverty Under the Age of 5
In terms of child poverty under the age of 5, the demographic groups most similar to Immigrants from Guyana are Osage (19.6%, a difference of 0.10%), Alaska Native (19.6%, a difference of 0.11%), Immigrants from Ghana (19.6%, a difference of 0.12%), Immigrants from Ecuador (19.6%, a difference of 0.18%), and Immigrants from Western Africa (19.7%, a difference of 0.31%).
| Demographics | Rating | Rank | Child Poverty Under the Age of 5 |
| Immigrants | Laos | 0.8 /100 | #235 | Tragic 19.4% |
| Immigrants | Trinidad and Tobago | 0.8 /100 | #236 | Tragic 19.4% |
| Immigrants | Cabo Verde | 0.6 /100 | #237 | Tragic 19.5% |
| Salvadorans | 0.6 /100 | #238 | Tragic 19.5% |
| Vietnamese | 0.6 /100 | #239 | Tragic 19.5% |
| Immigrants | Ecuador | 0.5 /100 | #240 | Tragic 19.6% |
| Alaska Natives | 0.5 /100 | #241 | Tragic 19.6% |
| Immigrants | Guyana | 0.5 /100 | #242 | Tragic 19.6% |
| Osage | 0.5 /100 | #243 | Tragic 19.6% |
| Immigrants | Ghana | 0.5 /100 | #244 | Tragic 19.6% |
| Immigrants | Western Africa | 0.4 /100 | #245 | Tragic 19.7% |
| Cree | 0.4 /100 | #246 | Tragic 19.7% |
| Guyanese | 0.4 /100 | #247 | Tragic 19.7% |
| Marshallese | 0.4 /100 | #248 | Tragic 19.7% |
| Immigrants | Middle Africa | 0.4 /100 | #249 | Tragic 19.7% |