Polish vs Peruvian Child Poverty Under the Age of 5
COMPARE
Polish
Peruvian
Child Poverty Under the Age of 5
Child Poverty Under the Age of 5 Comparison
Poles
Peruvians
15.7%
CHILD POVERTY UNDER THE AGE OF 5
97.2/ 100
METRIC RATING
91st/ 347
METRIC RANK
16.0%
CHILD POVERTY UNDER THE AGE OF 5
94.1/ 100
METRIC RATING
112th/ 347
METRIC RANK
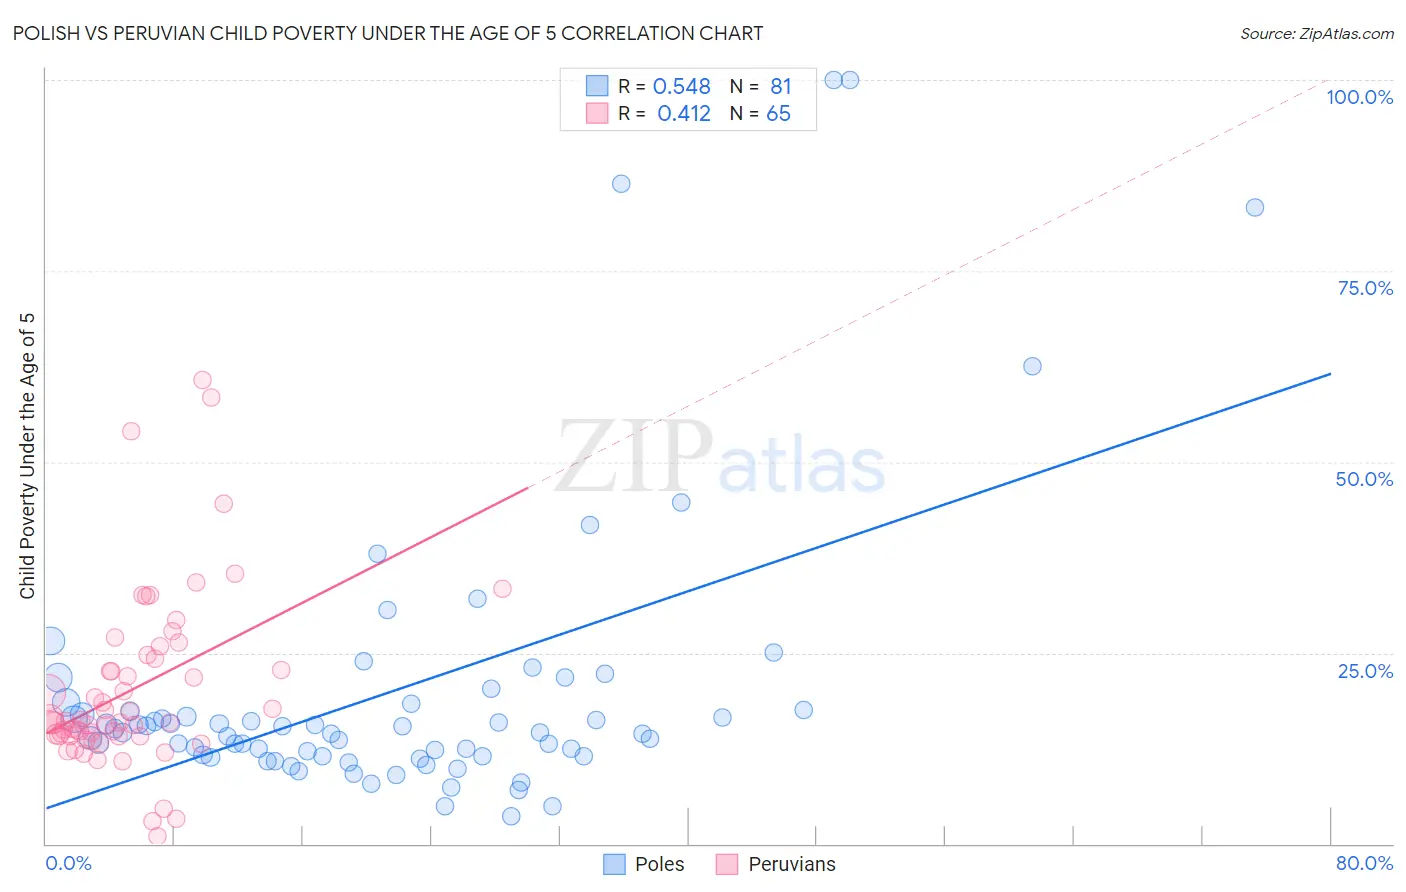
Polish vs Peruvian Child Poverty Under the Age of 5 Correlation Chart
The statistical analysis conducted on geographies consisting of 520,801,927 people shows a substantial positive correlation between the proportion of Poles and poverty level among children under the age of 5 in the United States with a correlation coefficient (R) of 0.548 and weighted average of 15.7%. Similarly, the statistical analysis conducted on geographies consisting of 350,289,776 people shows a moderate positive correlation between the proportion of Peruvians and poverty level among children under the age of 5 in the United States with a correlation coefficient (R) of 0.412 and weighted average of 16.0%, a difference of 2.2%.
Child Poverty Under the Age of 5 Correlation Summary
| Measurement | Polish | Peruvian |
| Minimum | 3.7% | 1.0% |
| Maximum | 100.0% | 60.7% |
| Range | 96.3% | 59.7% |
| Mean | 20.0% | 20.2% |
| Median | 14.6% | 15.9% |
| Interquartile 25% (IQ1) | 11.5% | 14.1% |
| Interquartile 75% (IQ3) | 17.9% | 24.4% |
| Interquartile Range (IQR) | 6.4% | 10.3% |
| Standard Deviation (Sample) | 18.9% | 11.6% |
| Standard Deviation (Population) | 18.8% | 11.5% |
Similar Demographics by Child Poverty Under the Age of 5
Demographics Similar to Poles by Child Poverty Under the Age of 5
In terms of child poverty under the age of 5, the demographic groups most similar to Poles are Scandinavian (15.7%, a difference of 0.060%), Ukrainian (15.7%, a difference of 0.090%), Immigrants from South Eastern Asia (15.7%, a difference of 0.10%), Immigrants from Croatia (15.6%, a difference of 0.11%), and Immigrants from France (15.6%, a difference of 0.11%).
| Demographics | Rating | Rank | Child Poverty Under the Age of 5 |
| Immigrants | Netherlands | 97.6 /100 | #84 | Exceptional 15.6% |
| Immigrants | Latvia | 97.4 /100 | #85 | Exceptional 15.6% |
| Immigrants | Malaysia | 97.4 /100 | #86 | Exceptional 15.6% |
| Immigrants | Vietnam | 97.4 /100 | #87 | Exceptional 15.6% |
| Jordanians | 97.3 /100 | #88 | Exceptional 15.6% |
| Immigrants | Croatia | 97.3 /100 | #89 | Exceptional 15.6% |
| Immigrants | France | 97.3 /100 | #90 | Exceptional 15.6% |
| Poles | 97.2 /100 | #91 | Exceptional 15.7% |
| Scandinavians | 97.1 /100 | #92 | Exceptional 15.7% |
| Ukrainians | 97.1 /100 | #93 | Exceptional 15.7% |
| Immigrants | South Eastern Asia | 97.1 /100 | #94 | Exceptional 15.7% |
| Immigrants | Switzerland | 96.4 /100 | #95 | Exceptional 15.8% |
| Immigrants | Kazakhstan | 96.2 /100 | #96 | Exceptional 15.8% |
| Macedonians | 96.2 /100 | #97 | Exceptional 15.8% |
| Immigrants | South Africa | 96.1 /100 | #98 | Exceptional 15.8% |
Demographics Similar to Peruvians by Child Poverty Under the Age of 5
In terms of child poverty under the age of 5, the demographic groups most similar to Peruvians are Puget Sound Salish (16.0%, a difference of 0.010%), Pakistani (16.0%, a difference of 0.050%), Romanian (16.0%, a difference of 0.090%), Immigrants from Kuwait (16.0%, a difference of 0.090%), and Northern European (16.0%, a difference of 0.10%).
| Demographics | Rating | Rank | Child Poverty Under the Age of 5 |
| Immigrants | Spain | 94.8 /100 | #105 | Exceptional 15.9% |
| Tlingit-Haida | 94.7 /100 | #106 | Exceptional 15.9% |
| Slovenes | 94.4 /100 | #107 | Exceptional 16.0% |
| Immigrants | Brazil | 94.4 /100 | #108 | Exceptional 16.0% |
| Northern Europeans | 94.3 /100 | #109 | Exceptional 16.0% |
| Romanians | 94.3 /100 | #110 | Exceptional 16.0% |
| Pakistanis | 94.2 /100 | #111 | Exceptional 16.0% |
| Peruvians | 94.1 /100 | #112 | Exceptional 16.0% |
| Puget Sound Salish | 94.1 /100 | #113 | Exceptional 16.0% |
| Immigrants | Kuwait | 93.9 /100 | #114 | Exceptional 16.0% |
| Albanians | 93.8 /100 | #115 | Exceptional 16.0% |
| Immigrants | Austria | 93.5 /100 | #116 | Exceptional 16.0% |
| Basques | 93.4 /100 | #117 | Exceptional 16.0% |
| Immigrants | Denmark | 93.4 /100 | #118 | Exceptional 16.0% |
| Immigrants | Jordan | 93.2 /100 | #119 | Exceptional 16.1% |