Czechoslovakian vs Immigrants from Guyana Child Poverty Under the Age of 5
COMPARE
Czechoslovakian
Immigrants from Guyana
Child Poverty Under the Age of 5
Child Poverty Under the Age of 5 Comparison
Czechoslovakians
Immigrants from Guyana
16.8%
CHILD POVERTY UNDER THE AGE OF 5
72.5/ 100
METRIC RATING
158th/ 347
METRIC RANK
19.6%
CHILD POVERTY UNDER THE AGE OF 5
0.5/ 100
METRIC RATING
242nd/ 347
METRIC RANK
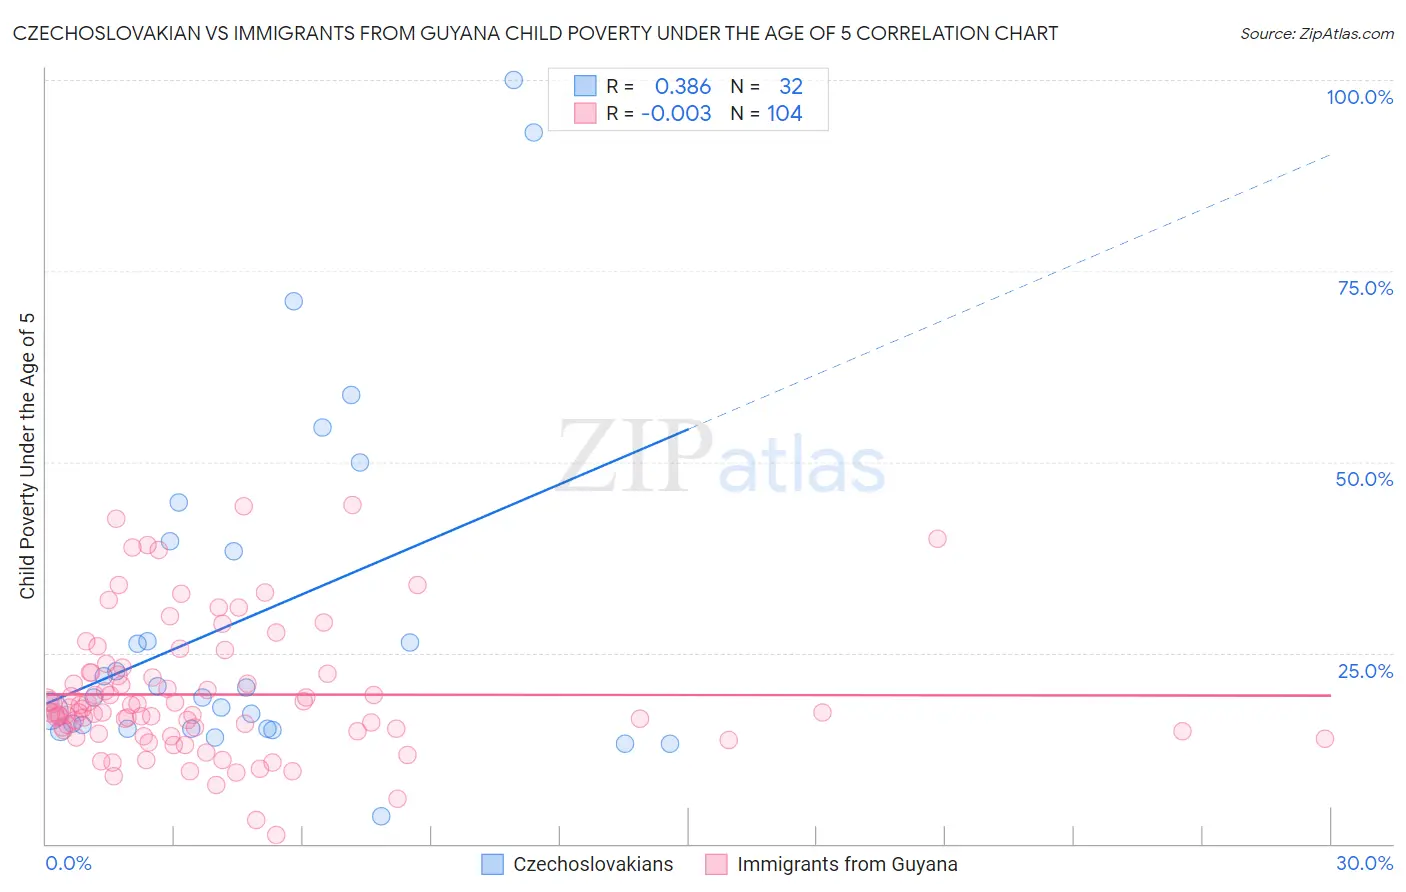
Czechoslovakian vs Immigrants from Guyana Child Poverty Under the Age of 5 Correlation Chart
The statistical analysis conducted on geographies consisting of 352,316,526 people shows a mild positive correlation between the proportion of Czechoslovakians and poverty level among children under the age of 5 in the United States with a correlation coefficient (R) of 0.386 and weighted average of 16.8%. Similarly, the statistical analysis conducted on geographies consisting of 179,217,429 people shows no correlation between the proportion of Immigrants from Guyana and poverty level among children under the age of 5 in the United States with a correlation coefficient (R) of -0.003 and weighted average of 19.6%, a difference of 16.8%.
Child Poverty Under the Age of 5 Correlation Summary
| Measurement | Czechoslovakian | Immigrants from Guyana |
| Minimum | 3.6% | 1.1% |
| Maximum | 100.0% | 44.4% |
| Range | 96.4% | 43.2% |
| Mean | 29.8% | 19.5% |
| Median | 19.8% | 17.2% |
| Interquartile 25% (IQ1) | 15.1% | 14.7% |
| Interquartile 75% (IQ3) | 39.0% | 22.3% |
| Interquartile Range (IQR) | 23.9% | 7.6% |
| Standard Deviation (Sample) | 23.3% | 8.6% |
| Standard Deviation (Population) | 23.0% | 8.6% |
Similar Demographics by Child Poverty Under the Age of 5
Demographics Similar to Czechoslovakians by Child Poverty Under the Age of 5
In terms of child poverty under the age of 5, the demographic groups most similar to Czechoslovakians are Immigrants from Syria (16.8%, a difference of 0.040%), Irish (16.8%, a difference of 0.060%), Venezuelan (16.8%, a difference of 0.16%), Afghan (16.8%, a difference of 0.26%), and English (16.8%, a difference of 0.28%).
| Demographics | Rating | Rank | Child Poverty Under the Age of 5 |
| Canadians | 77.6 /100 | #151 | Good 16.7% |
| Belgians | 77.2 /100 | #152 | Good 16.7% |
| Dutch | 77.1 /100 | #153 | Good 16.7% |
| Immigrants | Venezuela | 76.0 /100 | #154 | Good 16.7% |
| South Americans | 75.1 /100 | #155 | Good 16.7% |
| Afghans | 74.4 /100 | #156 | Good 16.8% |
| Venezuelans | 73.7 /100 | #157 | Good 16.8% |
| Czechoslovakians | 72.5 /100 | #158 | Good 16.8% |
| Immigrants | Syria | 72.3 /100 | #159 | Good 16.8% |
| Irish | 72.0 /100 | #160 | Good 16.8% |
| English | 70.4 /100 | #161 | Good 16.8% |
| Costa Ricans | 69.8 /100 | #162 | Good 16.9% |
| Scottish | 68.6 /100 | #163 | Good 16.9% |
| Immigrants | Oceania | 67.6 /100 | #164 | Good 16.9% |
| Immigrants | Colombia | 66.9 /100 | #165 | Good 16.9% |
Demographics Similar to Immigrants from Guyana by Child Poverty Under the Age of 5
In terms of child poverty under the age of 5, the demographic groups most similar to Immigrants from Guyana are Osage (19.6%, a difference of 0.10%), Alaska Native (19.6%, a difference of 0.11%), Immigrants from Ghana (19.6%, a difference of 0.12%), Immigrants from Ecuador (19.6%, a difference of 0.18%), and Immigrants from Western Africa (19.7%, a difference of 0.31%).
| Demographics | Rating | Rank | Child Poverty Under the Age of 5 |
| Immigrants | Laos | 0.8 /100 | #235 | Tragic 19.4% |
| Immigrants | Trinidad and Tobago | 0.8 /100 | #236 | Tragic 19.4% |
| Immigrants | Cabo Verde | 0.6 /100 | #237 | Tragic 19.5% |
| Salvadorans | 0.6 /100 | #238 | Tragic 19.5% |
| Vietnamese | 0.6 /100 | #239 | Tragic 19.5% |
| Immigrants | Ecuador | 0.5 /100 | #240 | Tragic 19.6% |
| Alaska Natives | 0.5 /100 | #241 | Tragic 19.6% |
| Immigrants | Guyana | 0.5 /100 | #242 | Tragic 19.6% |
| Osage | 0.5 /100 | #243 | Tragic 19.6% |
| Immigrants | Ghana | 0.5 /100 | #244 | Tragic 19.6% |
| Immigrants | Western Africa | 0.4 /100 | #245 | Tragic 19.7% |
| Cree | 0.4 /100 | #246 | Tragic 19.7% |
| Guyanese | 0.4 /100 | #247 | Tragic 19.7% |
| Marshallese | 0.4 /100 | #248 | Tragic 19.7% |
| Immigrants | Middle Africa | 0.4 /100 | #249 | Tragic 19.7% |