Pima vs Immigrants from Honduras Child Poverty Among Girls Under 16
COMPARE
Pima
Immigrants from Honduras
Child Poverty Among Girls Under 16
Child Poverty Among Girls Under 16 Comparison
Pima
Immigrants from Honduras
28.2%
CHILD POVERTY AMONG GIRLS UNDER 16
0.0/ 100
METRIC RATING
342nd/ 347
METRIC RANK
22.8%
CHILD POVERTY AMONG GIRLS UNDER 16
0.0/ 100
METRIC RATING
326th/ 347
METRIC RANK
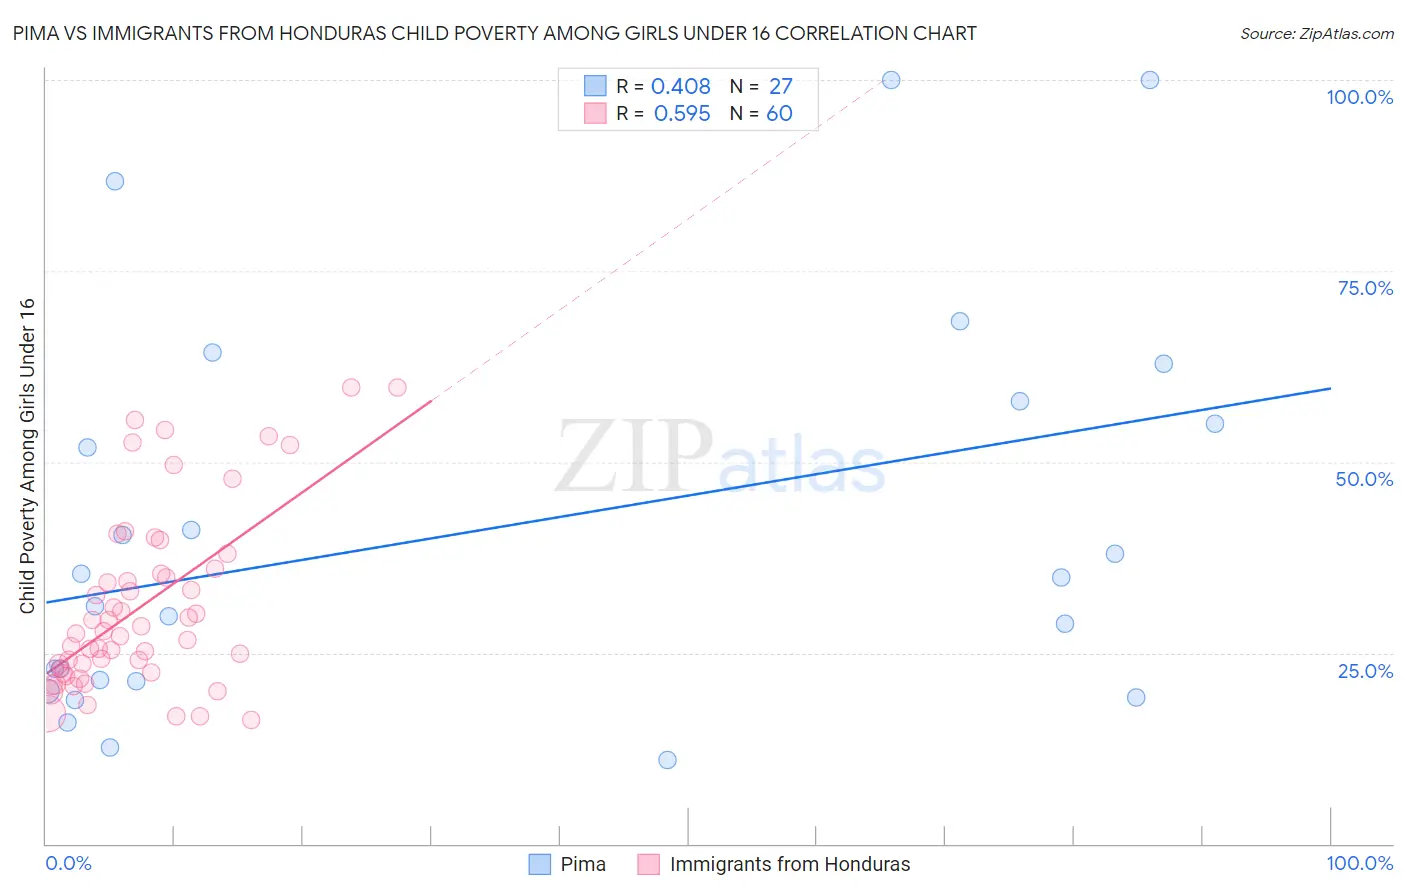
Pima vs Immigrants from Honduras Child Poverty Among Girls Under 16 Correlation Chart
The statistical analysis conducted on geographies consisting of 61,453,639 people shows a moderate positive correlation between the proportion of Pima and poverty level among girls under the age of 16 in the United States with a correlation coefficient (R) of 0.408 and weighted average of 28.2%. Similarly, the statistical analysis conducted on geographies consisting of 320,108,281 people shows a substantial positive correlation between the proportion of Immigrants from Honduras and poverty level among girls under the age of 16 in the United States with a correlation coefficient (R) of 0.595 and weighted average of 22.8%, a difference of 23.9%.
Child Poverty Among Girls Under 16 Correlation Summary
| Measurement | Pima | Immigrants from Honduras |
| Minimum | 11.0% | 16.3% |
| Maximum | 100.0% | 59.7% |
| Range | 89.0% | 43.5% |
| Mean | 41.2% | 31.1% |
| Median | 34.9% | 27.7% |
| Interquartile 25% (IQ1) | 21.2% | 22.7% |
| Interquartile 75% (IQ3) | 57.9% | 35.7% |
| Interquartile Range (IQR) | 36.7% | 13.0% |
| Standard Deviation (Sample) | 25.6% | 11.5% |
| Standard Deviation (Population) | 25.1% | 11.4% |
Demographics Similar to Pima and Immigrants from Honduras by Child Poverty Among Girls Under 16
In terms of child poverty among girls under 16, the demographic groups most similar to Pima are Hopi (27.9%, a difference of 1.3%), Yuman (27.1%, a difference of 4.2%), Immigrants from Yemen (29.5%, a difference of 4.5%), Crow (26.4%, a difference of 7.1%), and Cheyenne (26.3%, a difference of 7.4%). Similarly, the demographic groups most similar to Immigrants from Honduras are Immigrants from Congo (22.7%, a difference of 0.13%), Central American Indian (22.8%, a difference of 0.14%), Paiute (22.6%, a difference of 0.63%), Dominican (23.7%, a difference of 3.9%), and Kiowa (23.7%, a difference of 4.0%).
| Demographics | Rating | Rank | Child Poverty Among Girls Under 16 |
| Paiute | 0.0 /100 | #324 | Tragic 22.6% |
| Immigrants | Congo | 0.0 /100 | #325 | Tragic 22.7% |
| Immigrants | Honduras | 0.0 /100 | #326 | Tragic 22.8% |
| Central American Indians | 0.0 /100 | #327 | Tragic 22.8% |
| Dominicans | 0.0 /100 | #328 | Tragic 23.7% |
| Kiowa | 0.0 /100 | #329 | Tragic 23.7% |
| Immigrants | Dominican Republic | 0.0 /100 | #330 | Tragic 23.8% |
| Apache | 0.0 /100 | #331 | Tragic 23.8% |
| Natives/Alaskans | 0.0 /100 | #332 | Tragic 24.0% |
| Blacks/African Americans | 0.0 /100 | #333 | Tragic 24.7% |
| Menominee | 0.0 /100 | #334 | Tragic 25.0% |
| Pueblo | 0.0 /100 | #335 | Tragic 25.2% |
| Sioux | 0.0 /100 | #336 | Tragic 25.6% |
| Yup'ik | 0.0 /100 | #337 | Tragic 25.8% |
| Cheyenne | 0.0 /100 | #338 | Tragic 26.3% |
| Crow | 0.0 /100 | #339 | Tragic 26.4% |
| Yuman | 0.0 /100 | #340 | Tragic 27.1% |
| Hopi | 0.0 /100 | #341 | Tragic 27.9% |
| Pima | 0.0 /100 | #342 | Tragic 28.2% |
| Immigrants | Yemen | 0.0 /100 | #343 | Tragic 29.5% |
| Navajo | 0.0 /100 | #344 | Tragic 30.5% |