Pima vs Immigrants from Bolivia Seniors Poverty Over the Age of 75
COMPARE
Pima
Immigrants from Bolivia
Seniors Poverty Over the Age of 75
Seniors Poverty Over the Age of 75 Comparison
Pima
Immigrants from Bolivia
23.9%
SENIORS POVERTY OVER THE AGE OF 75
0.0/ 100
METRIC RATING
347th/ 347
METRIC RANK
11.7%
SENIORS POVERTY OVER THE AGE OF 75
88.4/ 100
METRIC RATING
112th/ 347
METRIC RANK
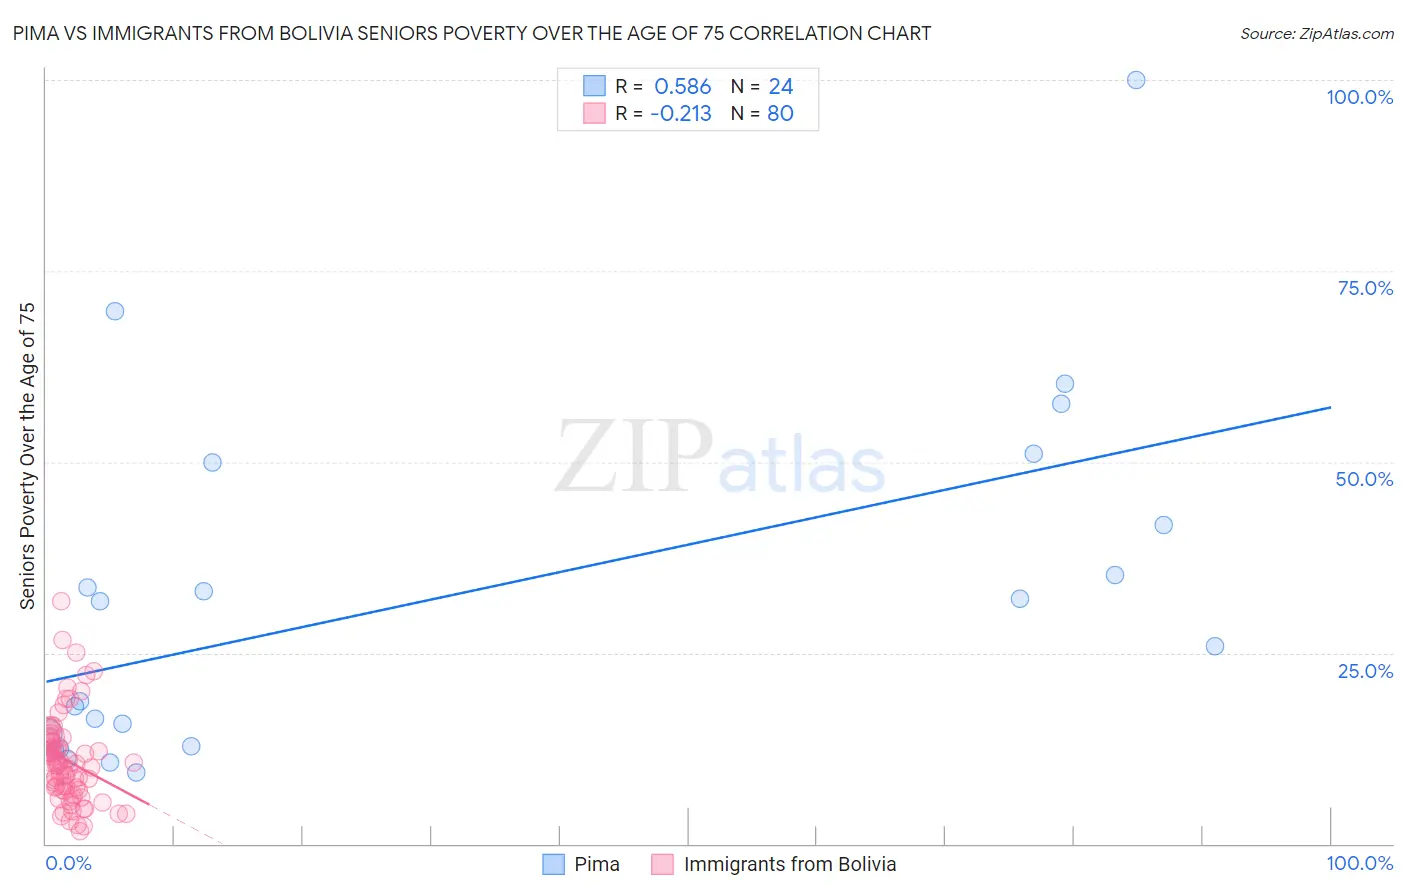
Pima vs Immigrants from Bolivia Seniors Poverty Over the Age of 75 Correlation Chart
The statistical analysis conducted on geographies consisting of 61,445,536 people shows a substantial positive correlation between the proportion of Pima and poverty level among seniors over the age of 75 in the United States with a correlation coefficient (R) of 0.586 and weighted average of 23.9%. Similarly, the statistical analysis conducted on geographies consisting of 157,814,166 people shows a weak negative correlation between the proportion of Immigrants from Bolivia and poverty level among seniors over the age of 75 in the United States with a correlation coefficient (R) of -0.213 and weighted average of 11.7%, a difference of 104.3%.
Seniors Poverty Over the Age of 75 Correlation Summary
| Measurement | Pima | Immigrants from Bolivia |
| Minimum | 9.4% | 1.7% |
| Maximum | 100.0% | 31.8% |
| Range | 90.6% | 30.1% |
| Mean | 32.2% | 10.8% |
| Median | 28.8% | 10.3% |
| Interquartile 25% (IQ1) | 13.6% | 7.1% |
| Interquartile 75% (IQ3) | 45.8% | 13.3% |
| Interquartile Range (IQR) | 32.3% | 6.2% |
| Standard Deviation (Sample) | 22.9% | 5.8% |
| Standard Deviation (Population) | 22.4% | 5.7% |
Similar Demographics by Seniors Poverty Over the Age of 75
Demographics Similar to Pima by Seniors Poverty Over the Age of 75
In terms of seniors poverty over the age of 75, the demographic groups most similar to Pima are Puerto Rican (23.2%, a difference of 2.9%), Immigrants from Dominican Republic (20.1%, a difference of 19.1%), Immigrants from Cuba (19.9%, a difference of 20.0%), Lumbee (19.7%, a difference of 20.9%), and Dominican (19.6%, a difference of 21.7%).
| Demographics | Rating | Rank | Seniors Poverty Over the Age of 75 |
| Immigrants | Nicaragua | 0.0 /100 | #333 | Tragic 17.6% |
| Immigrants | Grenada | 0.0 /100 | #334 | Tragic 17.8% |
| Cubans | 0.0 /100 | #335 | Tragic 18.0% |
| Immigrants | Caribbean | 0.0 /100 | #336 | Tragic 18.2% |
| Yakama | 0.0 /100 | #337 | Tragic 18.3% |
| Immigrants | Cabo Verde | 0.0 /100 | #338 | Tragic 18.5% |
| Hopi | 0.0 /100 | #339 | Tragic 18.9% |
| Tohono O'odham | 0.0 /100 | #340 | Tragic 19.1% |
| Navajo | 0.0 /100 | #341 | Tragic 19.4% |
| Dominicans | 0.0 /100 | #342 | Tragic 19.6% |
| Lumbee | 0.0 /100 | #343 | Tragic 19.7% |
| Immigrants | Cuba | 0.0 /100 | #344 | Tragic 19.9% |
| Immigrants | Dominican Republic | 0.0 /100 | #345 | Tragic 20.1% |
| Puerto Ricans | 0.0 /100 | #346 | Tragic 23.2% |
| Pima | 0.0 /100 | #347 | Tragic 23.9% |
Demographics Similar to Immigrants from Bolivia by Seniors Poverty Over the Age of 75
In terms of seniors poverty over the age of 75, the demographic groups most similar to Immigrants from Bolivia are Immigrants from Jordan (11.7%, a difference of 0.060%), Burmese (11.7%, a difference of 0.060%), Turkish (11.7%, a difference of 0.21%), South African (11.7%, a difference of 0.21%), and Immigrants from Oceania (11.7%, a difference of 0.22%).
| Demographics | Rating | Rank | Seniors Poverty Over the Age of 75 |
| Chickasaw | 90.2 /100 | #105 | Exceptional 11.6% |
| Russians | 89.9 /100 | #106 | Excellent 11.6% |
| Immigrants | Oceania | 89.4 /100 | #107 | Excellent 11.7% |
| Turks | 89.4 /100 | #108 | Excellent 11.7% |
| South Africans | 89.3 /100 | #109 | Excellent 11.7% |
| Immigrants | Jordan | 88.7 /100 | #110 | Excellent 11.7% |
| Burmese | 88.7 /100 | #111 | Excellent 11.7% |
| Immigrants | Bolivia | 88.4 /100 | #112 | Excellent 11.7% |
| Immigrants | Czechoslovakia | 87.0 /100 | #113 | Excellent 11.7% |
| Ukrainians | 86.9 /100 | #114 | Excellent 11.7% |
| New Zealanders | 86.3 /100 | #115 | Excellent 11.7% |
| Iraqis | 86.3 /100 | #116 | Excellent 11.7% |
| Icelanders | 85.7 /100 | #117 | Excellent 11.7% |
| Immigrants | Zimbabwe | 85.5 /100 | #118 | Excellent 11.7% |
| Immigrants | Uganda | 84.8 /100 | #119 | Excellent 11.8% |