Pueblo vs Guamanian/Chamorro Seniors Poverty Over the Age of 75
COMPARE
Pueblo
Guamanian/Chamorro
Seniors Poverty Over the Age of 75
Seniors Poverty Over the Age of 75 Comparison
Pueblo
Guamanians/Chamorros
16.7%
SENIORS POVERTY OVER THE AGE OF 75
0.0/ 100
METRIC RATING
326th/ 347
METRIC RANK
11.6%
SENIORS POVERTY OVER THE AGE OF 75
90.6/ 100
METRIC RATING
102nd/ 347
METRIC RANK
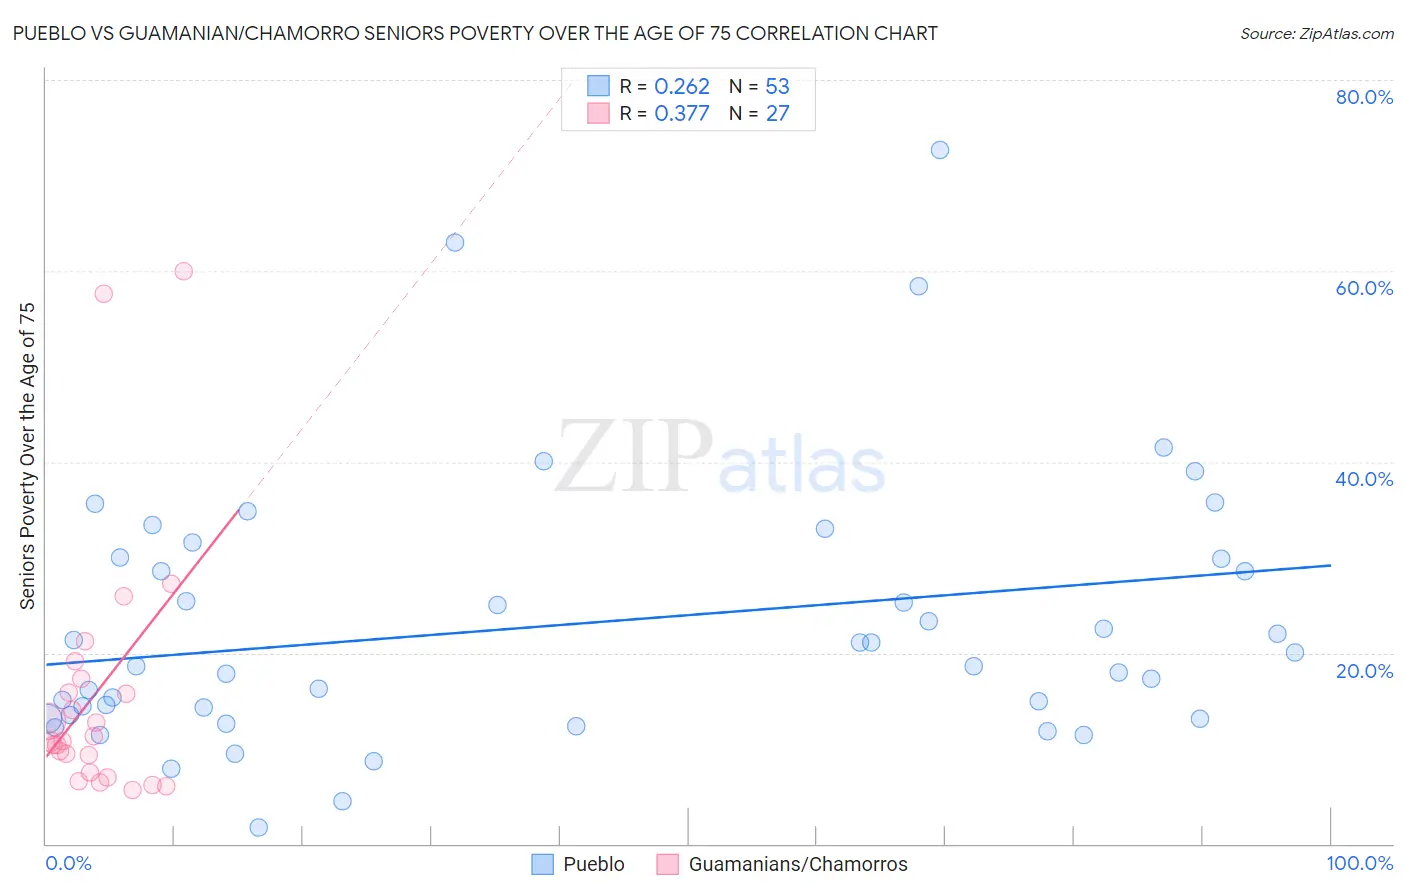
Pueblo vs Guamanian/Chamorro Seniors Poverty Over the Age of 75 Correlation Chart
The statistical analysis conducted on geographies consisting of 119,510,542 people shows a weak positive correlation between the proportion of Pueblo and poverty level among seniors over the age of 75 in the United States with a correlation coefficient (R) of 0.262 and weighted average of 16.7%. Similarly, the statistical analysis conducted on geographies consisting of 220,212,550 people shows a mild positive correlation between the proportion of Guamanians/Chamorros and poverty level among seniors over the age of 75 in the United States with a correlation coefficient (R) of 0.377 and weighted average of 11.6%, a difference of 43.9%.
Seniors Poverty Over the Age of 75 Correlation Summary
| Measurement | Pueblo | Guamanian/Chamorro |
| Minimum | 1.6% | 5.7% |
| Maximum | 72.7% | 60.0% |
| Range | 71.1% | 54.3% |
| Mean | 23.0% | 15.8% |
| Median | 18.6% | 10.8% |
| Interquartile 25% (IQ1) | 13.3% | 7.4% |
| Interquartile 75% (IQ3) | 29.9% | 17.3% |
| Interquartile Range (IQR) | 16.6% | 9.9% |
| Standard Deviation (Sample) | 14.0% | 13.7% |
| Standard Deviation (Population) | 13.9% | 13.4% |
Similar Demographics by Seniors Poverty Over the Age of 75
Demographics Similar to Pueblo by Seniors Poverty Over the Age of 75
In terms of seniors poverty over the age of 75, the demographic groups most similar to Pueblo are Sioux (16.8%, a difference of 0.21%), Cape Verdean (16.8%, a difference of 0.24%), Nicaraguan (16.6%, a difference of 0.70%), Immigrants from Uzbekistan (16.5%, a difference of 1.1%), and Central American Indian (16.5%, a difference of 1.1%).
| Demographics | Rating | Rank | Seniors Poverty Over the Age of 75 |
| Haitians | 0.0 /100 | #319 | Tragic 16.2% |
| Immigrants | Yemen | 0.0 /100 | #320 | Tragic 16.5% |
| Immigrants | Haiti | 0.0 /100 | #321 | Tragic 16.5% |
| Immigrants | Barbados | 0.0 /100 | #322 | Tragic 16.5% |
| Central American Indians | 0.0 /100 | #323 | Tragic 16.5% |
| Immigrants | Uzbekistan | 0.0 /100 | #324 | Tragic 16.5% |
| Nicaraguans | 0.0 /100 | #325 | Tragic 16.6% |
| Pueblo | 0.0 /100 | #326 | Tragic 16.7% |
| Sioux | 0.0 /100 | #327 | Tragic 16.8% |
| Cape Verdeans | 0.0 /100 | #328 | Tragic 16.8% |
| Immigrants | Dominica | 0.0 /100 | #329 | Tragic 17.0% |
| British West Indians | 0.0 /100 | #330 | Tragic 17.4% |
| Immigrants | Armenia | 0.0 /100 | #331 | Tragic 17.5% |
| Immigrants | St. Vincent and the Grenadines | 0.0 /100 | #332 | Tragic 17.5% |
| Immigrants | Nicaragua | 0.0 /100 | #333 | Tragic 17.6% |
Demographics Similar to Guamanians/Chamorros by Seniors Poverty Over the Age of 75
In terms of seniors poverty over the age of 75, the demographic groups most similar to Guamanians/Chamorros are Jordanian (11.6%, a difference of 0.040%), Immigrants from Kuwait (11.6%, a difference of 0.040%), Immigrants from Singapore (11.6%, a difference of 0.090%), Chickasaw (11.6%, a difference of 0.10%), and Syrian (11.6%, a difference of 0.12%).
| Demographics | Rating | Rank | Seniors Poverty Over the Age of 75 |
| Immigrants | Bosnia and Herzegovina | 92.6 /100 | #95 | Exceptional 11.6% |
| Immigrants | Sweden | 92.6 /100 | #96 | Exceptional 11.6% |
| Romanians | 92.3 /100 | #97 | Exceptional 11.6% |
| Immigrants | Japan | 91.9 /100 | #98 | Exceptional 11.6% |
| Immigrants | Ethiopia | 91.7 /100 | #99 | Exceptional 11.6% |
| Syrians | 91.1 /100 | #100 | Exceptional 11.6% |
| Jordanians | 90.8 /100 | #101 | Exceptional 11.6% |
| Guamanians/Chamorros | 90.6 /100 | #102 | Exceptional 11.6% |
| Immigrants | Kuwait | 90.5 /100 | #103 | Exceptional 11.6% |
| Immigrants | Singapore | 90.3 /100 | #104 | Exceptional 11.6% |
| Chickasaw | 90.2 /100 | #105 | Exceptional 11.6% |
| Russians | 89.9 /100 | #106 | Excellent 11.6% |
| Immigrants | Oceania | 89.4 /100 | #107 | Excellent 11.7% |
| Turks | 89.4 /100 | #108 | Excellent 11.7% |
| South Africans | 89.3 /100 | #109 | Excellent 11.7% |