Pima vs Apache Seniors Poverty Over the Age of 75
COMPARE
Pima
Apache
Seniors Poverty Over the Age of 75
Seniors Poverty Over the Age of 75 Comparison
Pima
Apache
23.9%
SENIORS POVERTY OVER THE AGE OF 75
0.0/ 100
METRIC RATING
347th/ 347
METRIC RANK
15.3%
SENIORS POVERTY OVER THE AGE OF 75
0.0/ 100
METRIC RATING
293rd/ 347
METRIC RANK
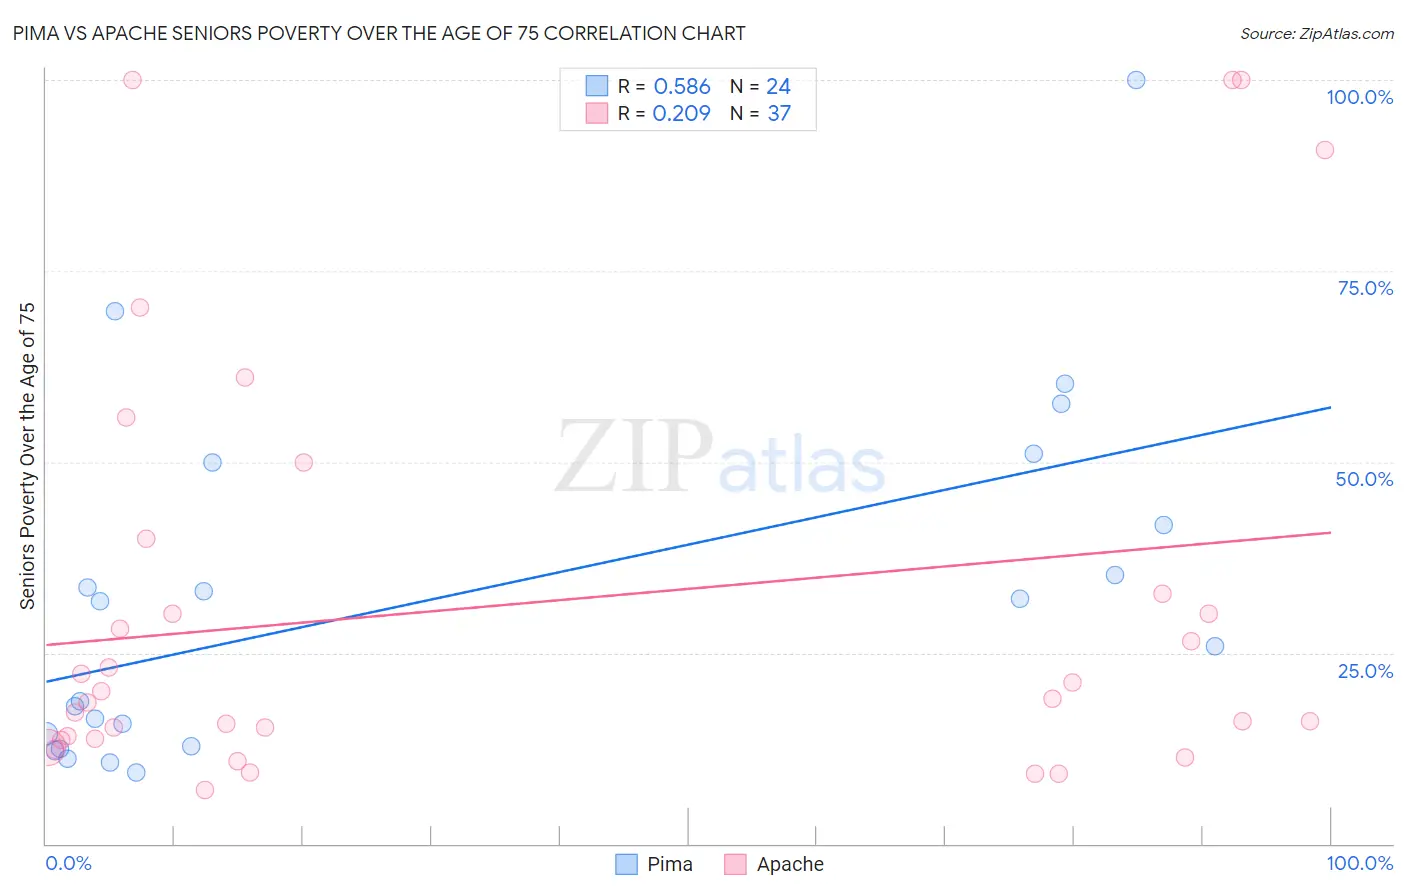
Pima vs Apache Seniors Poverty Over the Age of 75 Correlation Chart
The statistical analysis conducted on geographies consisting of 61,445,536 people shows a substantial positive correlation between the proportion of Pima and poverty level among seniors over the age of 75 in the United States with a correlation coefficient (R) of 0.586 and weighted average of 23.9%. Similarly, the statistical analysis conducted on geographies consisting of 229,385,853 people shows a weak positive correlation between the proportion of Apache and poverty level among seniors over the age of 75 in the United States with a correlation coefficient (R) of 0.209 and weighted average of 15.3%, a difference of 56.3%.
Seniors Poverty Over the Age of 75 Correlation Summary
| Measurement | Pima | Apache |
| Minimum | 9.4% | 7.0% |
| Maximum | 100.0% | 100.0% |
| Range | 90.6% | 93.0% |
| Mean | 32.2% | 31.3% |
| Median | 28.8% | 19.0% |
| Interquartile 25% (IQ1) | 13.6% | 13.7% |
| Interquartile 75% (IQ3) | 45.8% | 36.4% |
| Interquartile Range (IQR) | 32.3% | 22.7% |
| Standard Deviation (Sample) | 22.9% | 27.8% |
| Standard Deviation (Population) | 22.4% | 27.4% |
Similar Demographics by Seniors Poverty Over the Age of 75
Demographics Similar to Pima by Seniors Poverty Over the Age of 75
In terms of seniors poverty over the age of 75, the demographic groups most similar to Pima are Puerto Rican (23.2%, a difference of 2.9%), Immigrants from Dominican Republic (20.1%, a difference of 19.1%), Immigrants from Cuba (19.9%, a difference of 20.0%), Lumbee (19.7%, a difference of 20.9%), and Dominican (19.6%, a difference of 21.7%).
| Demographics | Rating | Rank | Seniors Poverty Over the Age of 75 |
| Immigrants | Nicaragua | 0.0 /100 | #333 | Tragic 17.6% |
| Immigrants | Grenada | 0.0 /100 | #334 | Tragic 17.8% |
| Cubans | 0.0 /100 | #335 | Tragic 18.0% |
| Immigrants | Caribbean | 0.0 /100 | #336 | Tragic 18.2% |
| Yakama | 0.0 /100 | #337 | Tragic 18.3% |
| Immigrants | Cabo Verde | 0.0 /100 | #338 | Tragic 18.5% |
| Hopi | 0.0 /100 | #339 | Tragic 18.9% |
| Tohono O'odham | 0.0 /100 | #340 | Tragic 19.1% |
| Navajo | 0.0 /100 | #341 | Tragic 19.4% |
| Dominicans | 0.0 /100 | #342 | Tragic 19.6% |
| Lumbee | 0.0 /100 | #343 | Tragic 19.7% |
| Immigrants | Cuba | 0.0 /100 | #344 | Tragic 19.9% |
| Immigrants | Dominican Republic | 0.0 /100 | #345 | Tragic 20.1% |
| Puerto Ricans | 0.0 /100 | #346 | Tragic 23.2% |
| Pima | 0.0 /100 | #347 | Tragic 23.9% |
Demographics Similar to Apache by Seniors Poverty Over the Age of 75
In terms of seniors poverty over the age of 75, the demographic groups most similar to Apache are Colville (15.2%, a difference of 0.40%), Immigrants from Jamaica (15.3%, a difference of 0.45%), Paiute (15.2%, a difference of 0.58%), Immigrants from the Azores (15.2%, a difference of 0.60%), and Immigrants from Belize (15.2%, a difference of 0.61%).
| Demographics | Rating | Rank | Seniors Poverty Over the Age of 75 |
| Immigrants | Central America | 0.0 /100 | #286 | Tragic 15.0% |
| Immigrants | Guatemala | 0.0 /100 | #287 | Tragic 15.1% |
| Jamaicans | 0.0 /100 | #288 | Tragic 15.1% |
| Immigrants | Belize | 0.0 /100 | #289 | Tragic 15.2% |
| Immigrants | Azores | 0.0 /100 | #290 | Tragic 15.2% |
| Paiute | 0.0 /100 | #291 | Tragic 15.2% |
| Colville | 0.0 /100 | #292 | Tragic 15.2% |
| Apache | 0.0 /100 | #293 | Tragic 15.3% |
| Immigrants | Jamaica | 0.0 /100 | #294 | Tragic 15.3% |
| U.S. Virgin Islanders | 0.0 /100 | #295 | Tragic 15.4% |
| Yuman | 0.0 /100 | #296 | Tragic 15.4% |
| Hondurans | 0.0 /100 | #297 | Tragic 15.4% |
| Natives/Alaskans | 0.0 /100 | #298 | Tragic 15.5% |
| Spanish American Indians | 0.0 /100 | #299 | Tragic 15.5% |
| Bahamians | 0.0 /100 | #300 | Tragic 15.5% |