Peruvian vs Honduran Child Poverty Under the Age of 16
COMPARE
Peruvian
Honduran
Child Poverty Under the Age of 16
Child Poverty Under the Age of 16 Comparison
Peruvians
Hondurans
15.3%
CHILD POVERTY UNDER THE AGE OF 16
87.2/ 100
METRIC RATING
137th/ 347
METRIC RANK
22.2%
CHILD POVERTY UNDER THE AGE OF 16
0.0/ 100
METRIC RATING
322nd/ 347
METRIC RANK
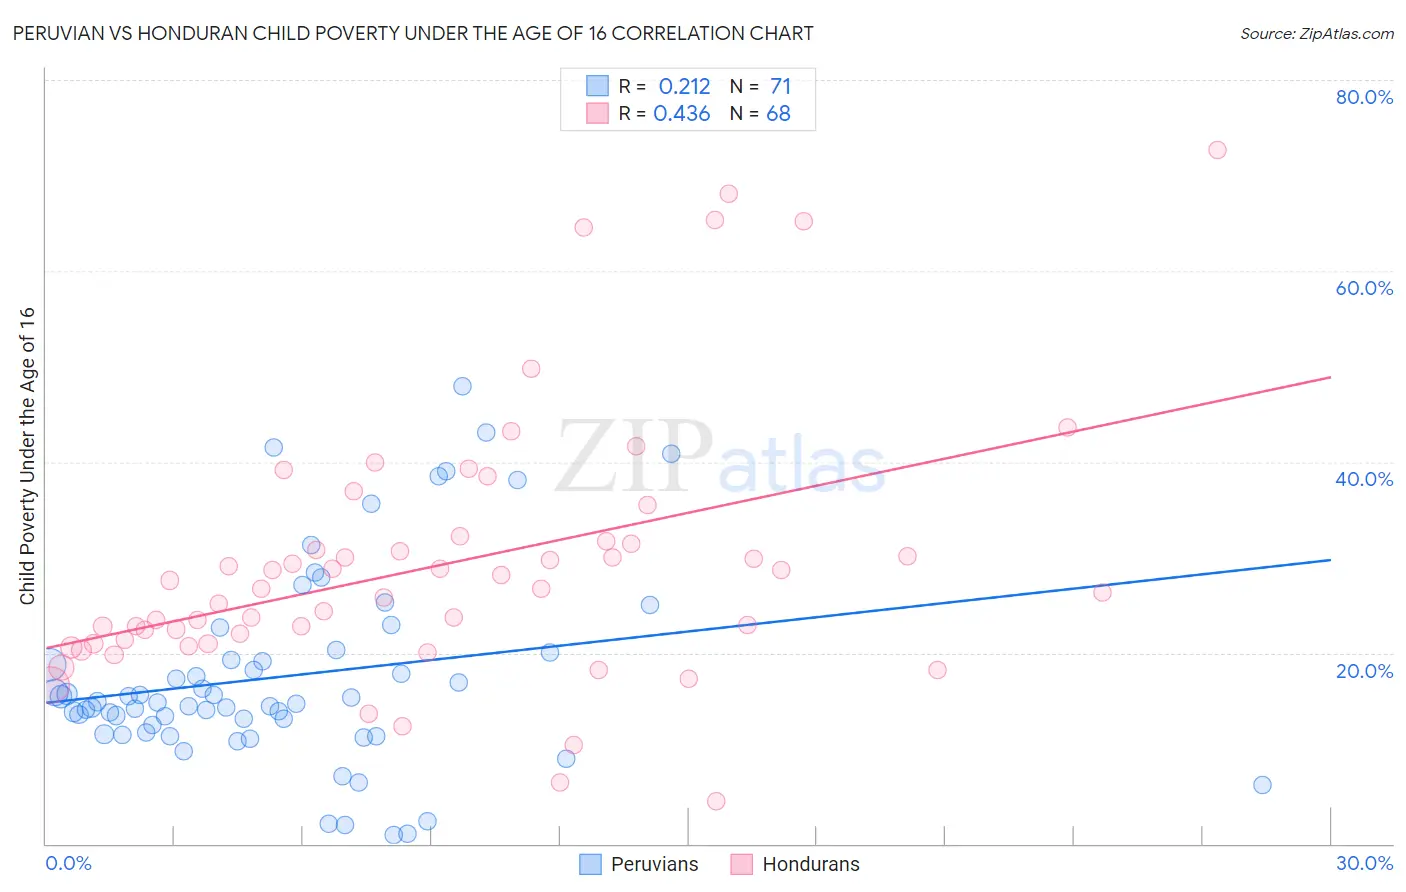
Peruvian vs Honduran Child Poverty Under the Age of 16 Correlation Chart
The statistical analysis conducted on geographies consisting of 360,550,720 people shows a weak positive correlation between the proportion of Peruvians and poverty level among children under the age of 16 in the United States with a correlation coefficient (R) of 0.212 and weighted average of 15.3%. Similarly, the statistical analysis conducted on geographies consisting of 356,140,791 people shows a moderate positive correlation between the proportion of Hondurans and poverty level among children under the age of 16 in the United States with a correlation coefficient (R) of 0.436 and weighted average of 22.2%, a difference of 45.4%.
Child Poverty Under the Age of 16 Correlation Summary
| Measurement | Peruvian | Honduran |
| Minimum | 0.90% | 4.4% |
| Maximum | 47.9% | 72.7% |
| Range | 47.0% | 68.3% |
| Mean | 17.6% | 29.2% |
| Median | 14.8% | 26.8% |
| Interquartile 25% (IQ1) | 11.7% | 21.2% |
| Interquartile 75% (IQ3) | 20.0% | 31.5% |
| Interquartile Range (IQR) | 8.3% | 10.4% |
| Standard Deviation (Sample) | 10.3% | 13.7% |
| Standard Deviation (Population) | 10.2% | 13.6% |
Similar Demographics by Child Poverty Under the Age of 16
Demographics Similar to Peruvians by Child Poverty Under the Age of 16
In terms of child poverty under the age of 16, the demographic groups most similar to Peruvians are Welsh (15.3%, a difference of 0.010%), Immigrants from Spain (15.3%, a difference of 0.030%), Immigrants from Vietnam (15.3%, a difference of 0.050%), New Zealander (15.3%, a difference of 0.11%), and Albanian (15.2%, a difference of 0.40%).
| Demographics | Rating | Rank | Child Poverty Under the Age of 16 |
| Mongolians | 89.5 /100 | #130 | Excellent 15.2% |
| Armenians | 89.4 /100 | #131 | Excellent 15.2% |
| Canadians | 89.1 /100 | #132 | Excellent 15.2% |
| Immigrants | South Eastern Asia | 89.0 /100 | #133 | Excellent 15.2% |
| Native Hawaiians | 88.7 /100 | #134 | Excellent 15.2% |
| Albanians | 88.6 /100 | #135 | Excellent 15.2% |
| Immigrants | Spain | 87.3 /100 | #136 | Excellent 15.3% |
| Peruvians | 87.2 /100 | #137 | Excellent 15.3% |
| Welsh | 87.2 /100 | #138 | Excellent 15.3% |
| Immigrants | Vietnam | 87.1 /100 | #139 | Excellent 15.3% |
| New Zealanders | 86.9 /100 | #140 | Excellent 15.3% |
| Slavs | 84.2 /100 | #141 | Excellent 15.4% |
| Brazilians | 82.8 /100 | #142 | Excellent 15.4% |
| Icelanders | 82.5 /100 | #143 | Excellent 15.4% |
| Immigrants | Hungary | 81.9 /100 | #144 | Excellent 15.5% |
Demographics Similar to Hondurans by Child Poverty Under the Age of 16
In terms of child poverty under the age of 16, the demographic groups most similar to Hondurans are Kiowa (22.2%, a difference of 0.19%), Cajun (22.1%, a difference of 0.37%), Yakama (22.1%, a difference of 0.58%), Paiute (22.4%, a difference of 1.0%), and U.S. Virgin Islander (22.0%, a difference of 1.1%).
| Demographics | Rating | Rank | Child Poverty Under the Age of 16 |
| Immigrants | Guatemala | 0.0 /100 | #315 | Tragic 21.6% |
| Africans | 0.0 /100 | #316 | Tragic 21.7% |
| Immigrants | Dominica | 0.0 /100 | #317 | Tragic 21.9% |
| U.S. Virgin Islanders | 0.0 /100 | #318 | Tragic 22.0% |
| Yakama | 0.0 /100 | #319 | Tragic 22.1% |
| Cajuns | 0.0 /100 | #320 | Tragic 22.1% |
| Kiowa | 0.0 /100 | #321 | Tragic 22.2% |
| Hondurans | 0.0 /100 | #322 | Tragic 22.2% |
| Paiute | 0.0 /100 | #323 | Tragic 22.4% |
| Central American Indians | 0.0 /100 | #324 | Tragic 22.5% |
| Immigrants | Congo | 0.0 /100 | #325 | Tragic 22.5% |
| Immigrants | Honduras | 0.0 /100 | #326 | Tragic 22.7% |
| Menominee | 0.0 /100 | #327 | Tragic 23.0% |
| Colville | 0.0 /100 | #328 | Tragic 23.0% |
| Dominicans | 0.0 /100 | #329 | Tragic 23.8% |