Peruvian vs Mongolian 3rd Grade
COMPARE
Peruvian
Mongolian
3rd Grade
3rd Grade Comparison
Peruvians
Mongolians
97.4%
3RD GRADE
0.8/ 100
METRIC RATING
252nd/ 347
METRIC RANK
97.7%
3RD GRADE
29.1/ 100
METRIC RATING
192nd/ 347
METRIC RANK
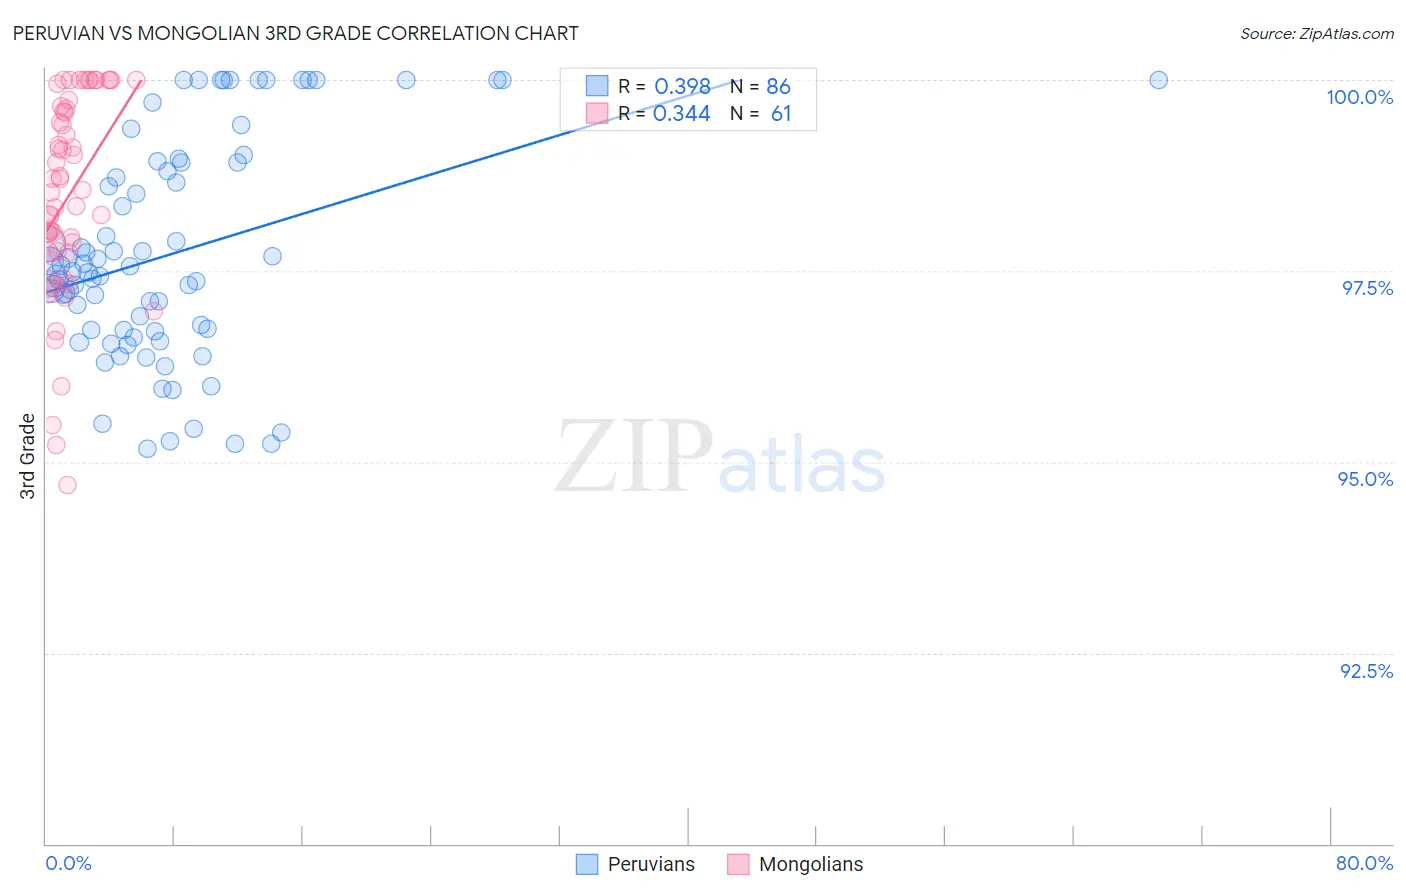
Peruvian vs Mongolian 3rd Grade Correlation Chart
The statistical analysis conducted on geographies consisting of 363,068,462 people shows a mild positive correlation between the proportion of Peruvians and percentage of population with at least 3rd grade education in the United States with a correlation coefficient (R) of 0.398 and weighted average of 97.4%. Similarly, the statistical analysis conducted on geographies consisting of 140,362,004 people shows a mild positive correlation between the proportion of Mongolians and percentage of population with at least 3rd grade education in the United States with a correlation coefficient (R) of 0.344 and weighted average of 97.7%, a difference of 0.33%.
3rd Grade Correlation Summary
| Measurement | Peruvian | Mongolian |
| Minimum | 95.2% | 94.7% |
| Maximum | 100.0% | 100.0% |
| Range | 4.8% | 5.3% |
| Mean | 97.7% | 98.5% |
| Median | 97.5% | 98.6% |
| Interquartile 25% (IQ1) | 96.7% | 97.7% |
| Interquartile 75% (IQ3) | 98.9% | 99.6% |
| Interquartile Range (IQR) | 2.2% | 1.9% |
| Standard Deviation (Sample) | 1.4% | 1.3% |
| Standard Deviation (Population) | 1.4% | 1.3% |
Similar Demographics by 3rd Grade
Demographics Similar to Peruvians by 3rd Grade
In terms of 3rd grade, the demographic groups most similar to Peruvians are Immigrants from Asia (97.4%, a difference of 0.0%), Immigrants from Africa (97.4%, a difference of 0.0%), Immigrants from Eastern Africa (97.4%, a difference of 0.010%), South American (97.4%, a difference of 0.010%), and Immigrants from Middle Africa (97.4%, a difference of 0.010%).
| Demographics | Rating | Rank | 3rd Grade |
| Ethiopians | 1.1 /100 | #245 | Tragic 97.4% |
| Immigrants | Senegal | 1.0 /100 | #246 | Tragic 97.4% |
| Assyrians/Chaldeans/Syriacs | 1.0 /100 | #247 | Tragic 97.4% |
| Immigrants | Eastern Africa | 0.9 /100 | #248 | Tragic 97.4% |
| South Americans | 0.9 /100 | #249 | Tragic 97.4% |
| Immigrants | Middle Africa | 0.9 /100 | #250 | Tragic 97.4% |
| Immigrants | Asia | 0.8 /100 | #251 | Tragic 97.4% |
| Peruvians | 0.8 /100 | #252 | Tragic 97.4% |
| Immigrants | Africa | 0.8 /100 | #253 | Tragic 97.4% |
| Jamaicans | 0.7 /100 | #254 | Tragic 97.4% |
| Bolivians | 0.6 /100 | #255 | Tragic 97.3% |
| Immigrants | Congo | 0.6 /100 | #256 | Tragic 97.3% |
| Immigrants | Colombia | 0.5 /100 | #257 | Tragic 97.3% |
| Immigrants | Liberia | 0.5 /100 | #258 | Tragic 97.3% |
| Armenians | 0.4 /100 | #259 | Tragic 97.3% |
Demographics Similar to Mongolians by 3rd Grade
In terms of 3rd grade, the demographic groups most similar to Mongolians are Black/African American (97.7%, a difference of 0.0%), Immigrants from Kenya (97.7%, a difference of 0.0%), Panamanian (97.7%, a difference of 0.010%), Immigrants from Uganda (97.7%, a difference of 0.010%), and Immigrants from Egypt (97.7%, a difference of 0.010%).
| Demographics | Rating | Rank | 3rd Grade |
| Immigrants | Argentina | 37.0 /100 | #185 | Fair 97.7% |
| Portuguese | 36.2 /100 | #186 | Fair 97.7% |
| Natives/Alaskans | 35.2 /100 | #187 | Fair 97.7% |
| Immigrants | Taiwan | 34.2 /100 | #188 | Fair 97.7% |
| Pakistanis | 34.2 /100 | #189 | Fair 97.7% |
| Panamanians | 31.5 /100 | #190 | Fair 97.7% |
| Blacks/African Americans | 29.6 /100 | #191 | Fair 97.7% |
| Mongolians | 29.1 /100 | #192 | Fair 97.7% |
| Immigrants | Kenya | 28.2 /100 | #193 | Fair 97.7% |
| Immigrants | Uganda | 27.4 /100 | #194 | Fair 97.7% |
| Immigrants | Egypt | 26.8 /100 | #195 | Fair 97.7% |
| Paraguayans | 26.2 /100 | #196 | Fair 97.7% |
| Hawaiians | 25.7 /100 | #197 | Fair 97.7% |
| Guamanians/Chamorros | 23.6 /100 | #198 | Fair 97.7% |
| Immigrants | Ukraine | 22.7 /100 | #199 | Fair 97.7% |