Paraguayan vs Mexican American Indian Median Family Income
COMPARE
Paraguayan
Mexican American Indian
Median Family Income
Median Family Income Comparison
Paraguayans
Mexican American Indians
$114,016
MEDIAN FAMILY INCOME
99.7/ 100
METRIC RATING
66th/ 347
METRIC RANK
$90,918
MEDIAN FAMILY INCOME
0.2/ 100
METRIC RATING
267th/ 347
METRIC RANK
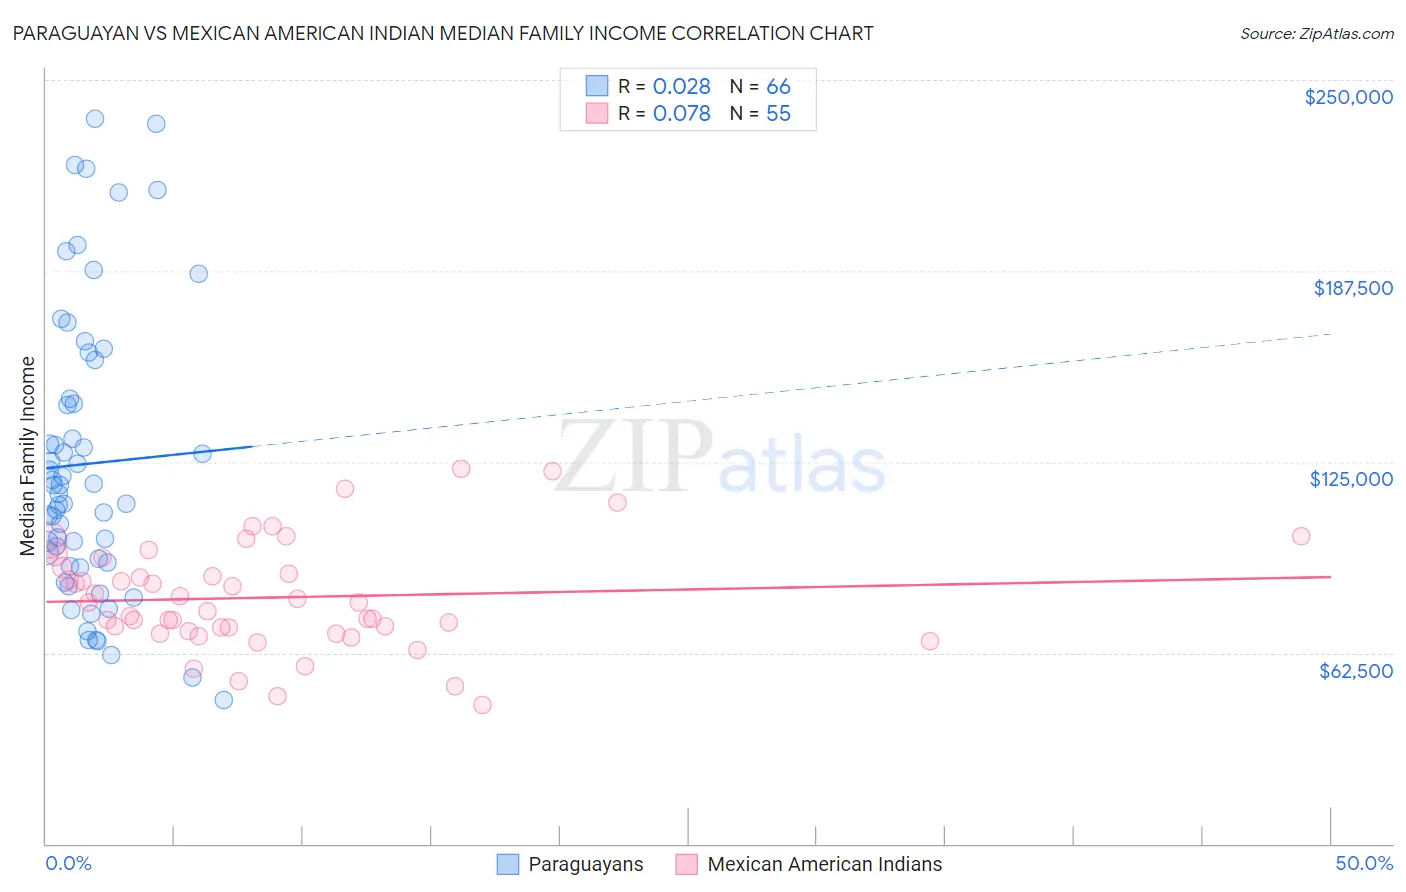
Paraguayan vs Mexican American Indian Median Family Income Correlation Chart
The statistical analysis conducted on geographies consisting of 95,094,698 people shows no correlation between the proportion of Paraguayans and median family income in the United States with a correlation coefficient (R) of 0.028 and weighted average of $114,016. Similarly, the statistical analysis conducted on geographies consisting of 317,461,685 people shows a slight positive correlation between the proportion of Mexican American Indians and median family income in the United States with a correlation coefficient (R) of 0.078 and weighted average of $90,918, a difference of 25.4%.
Median Family Income Correlation Summary
| Measurement | Paraguayan | Mexican American Indian |
| Minimum | $47,188 | $45,568 |
| Maximum | $237,188 | $122,917 |
| Range | $190,000 | $77,349 |
| Mean | $124,379 | $80,601 |
| Median | $115,994 | $78,819 |
| Interquartile 25% (IQ1) | $91,993 | $69,567 |
| Interquartile 75% (IQ3) | $145,560 | $90,530 |
| Interquartile Range (IQR) | $53,567 | $20,964 |
| Standard Deviation (Sample) | $46,622 | $17,524 |
| Standard Deviation (Population) | $46,268 | $17,364 |
Similar Demographics by Median Family Income
Demographics Similar to Paraguayans by Median Family Income
In terms of median family income, the demographic groups most similar to Paraguayans are Egyptian ($114,119, a difference of 0.090%), Immigrants from Spain ($113,815, a difference of 0.18%), Immigrants from Scotland ($114,392, a difference of 0.33%), Immigrants from Pakistan ($114,406, a difference of 0.34%), and Mongolian ($114,553, a difference of 0.47%).
| Demographics | Rating | Rank | Median Family Income |
| Immigrants | Netherlands | 99.8 /100 | #59 | Exceptional $114,987 |
| Immigrants | Latvia | 99.8 /100 | #60 | Exceptional $114,826 |
| Immigrants | Belarus | 99.8 /100 | #61 | Exceptional $114,586 |
| Mongolians | 99.8 /100 | #62 | Exceptional $114,553 |
| Immigrants | Pakistan | 99.8 /100 | #63 | Exceptional $114,406 |
| Immigrants | Scotland | 99.7 /100 | #64 | Exceptional $114,392 |
| Egyptians | 99.7 /100 | #65 | Exceptional $114,119 |
| Paraguayans | 99.7 /100 | #66 | Exceptional $114,016 |
| Immigrants | Spain | 99.7 /100 | #67 | Exceptional $113,815 |
| Immigrants | Serbia | 99.6 /100 | #68 | Exceptional $113,463 |
| Immigrants | Bulgaria | 99.6 /100 | #69 | Exceptional $113,461 |
| Immigrants | Romania | 99.6 /100 | #70 | Exceptional $113,434 |
| South Africans | 99.5 /100 | #71 | Exceptional $113,229 |
| Afghans | 99.5 /100 | #72 | Exceptional $112,971 |
| Laotians | 99.5 /100 | #73 | Exceptional $112,859 |
Demographics Similar to Mexican American Indians by Median Family Income
In terms of median family income, the demographic groups most similar to Mexican American Indians are Cree ($90,882, a difference of 0.040%), Belizean ($90,880, a difference of 0.040%), Central American ($91,087, a difference of 0.19%), Jamaican ($90,581, a difference of 0.37%), and Iroquois ($90,543, a difference of 0.41%).
| Demographics | Rating | Rank | Median Family Income |
| Pennsylvania Germans | 0.4 /100 | #260 | Tragic $91,763 |
| Inupiat | 0.4 /100 | #261 | Tragic $91,730 |
| Liberians | 0.4 /100 | #262 | Tragic $91,722 |
| Immigrants | West Indies | 0.3 /100 | #263 | Tragic $91,588 |
| Senegalese | 0.3 /100 | #264 | Tragic $91,475 |
| Hmong | 0.3 /100 | #265 | Tragic $91,296 |
| Central Americans | 0.3 /100 | #266 | Tragic $91,087 |
| Mexican American Indians | 0.2 /100 | #267 | Tragic $90,918 |
| Cree | 0.2 /100 | #268 | Tragic $90,882 |
| Belizeans | 0.2 /100 | #269 | Tragic $90,880 |
| Jamaicans | 0.2 /100 | #270 | Tragic $90,581 |
| Iroquois | 0.2 /100 | #271 | Tragic $90,543 |
| Immigrants | Liberia | 0.2 /100 | #272 | Tragic $90,450 |
| Immigrants | Micronesia | 0.2 /100 | #273 | Tragic $90,345 |
| Spanish Americans | 0.2 /100 | #274 | Tragic $90,322 |