Paraguayan vs Mexican American Indian 9th Grade
COMPARE
Paraguayan
Mexican American Indian
9th Grade
9th Grade Comparison
Paraguayans
Mexican American Indians
94.7%
9TH GRADE
30.1/ 100
METRIC RATING
193rd/ 347
METRIC RANK
90.9%
9TH GRADE
0.0/ 100
METRIC RATING
331st/ 347
METRIC RANK
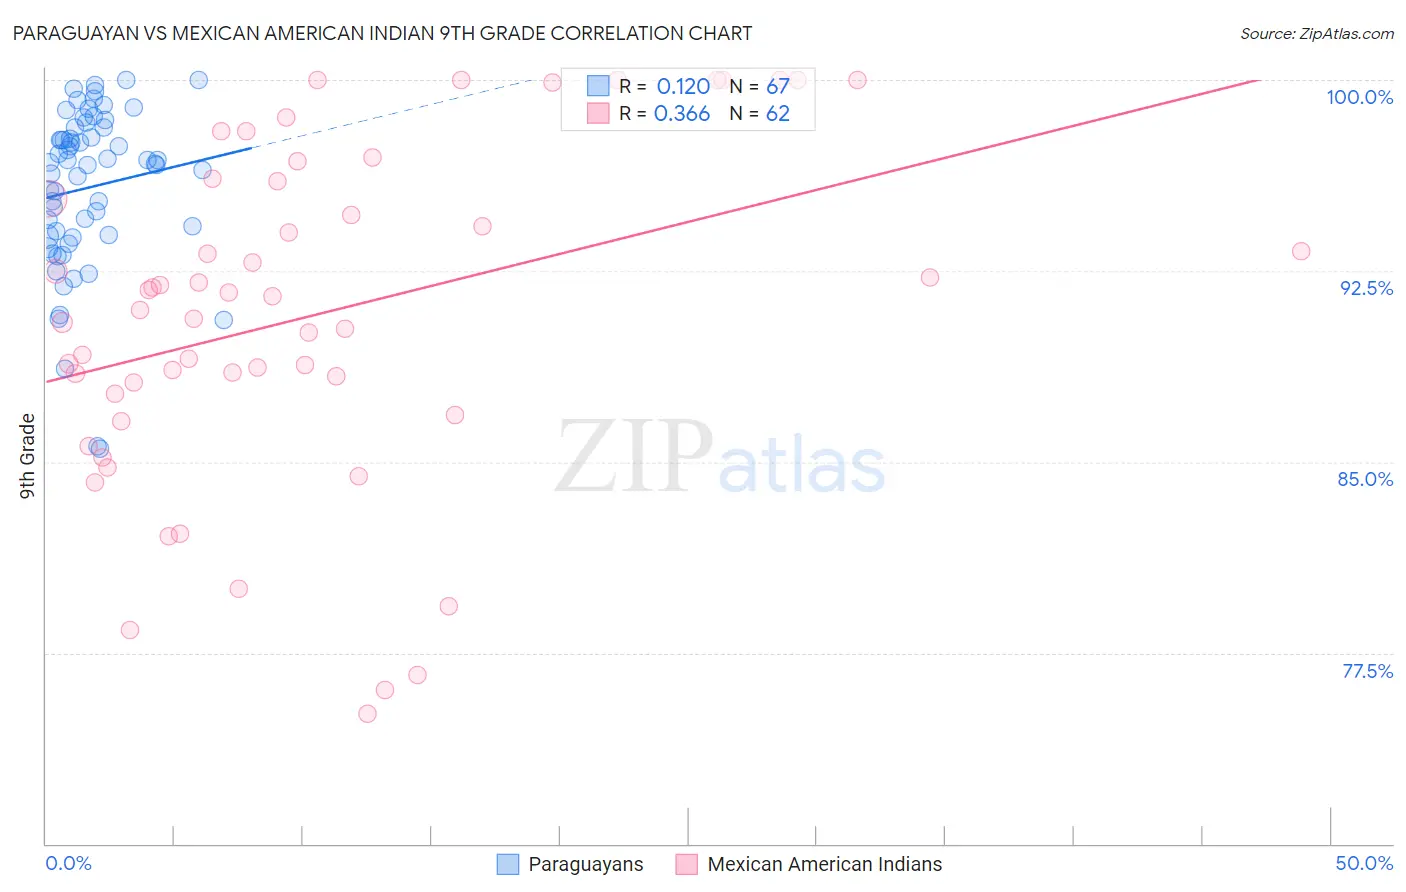
Paraguayan vs Mexican American Indian 9th Grade Correlation Chart
The statistical analysis conducted on geographies consisting of 95,114,701 people shows a poor positive correlation between the proportion of Paraguayans and percentage of population with at least 9th grade education in the United States with a correlation coefficient (R) of 0.120 and weighted average of 94.7%. Similarly, the statistical analysis conducted on geographies consisting of 317,621,104 people shows a mild positive correlation between the proportion of Mexican American Indians and percentage of population with at least 9th grade education in the United States with a correlation coefficient (R) of 0.366 and weighted average of 90.9%, a difference of 4.2%.
9th Grade Correlation Summary
| Measurement | Paraguayan | Mexican American Indian |
| Minimum | 85.5% | 75.1% |
| Maximum | 100.0% | 100.0% |
| Range | 14.5% | 24.9% |
| Mean | 95.8% | 90.8% |
| Median | 96.7% | 91.2% |
| Interquartile 25% (IQ1) | 93.8% | 87.7% |
| Interquartile 75% (IQ3) | 98.1% | 96.0% |
| Interquartile Range (IQR) | 4.3% | 8.3% |
| Standard Deviation (Sample) | 3.2% | 6.6% |
| Standard Deviation (Population) | 3.2% | 6.5% |
Similar Demographics by 9th Grade
Demographics Similar to Paraguayans by 9th Grade
In terms of 9th grade, the demographic groups most similar to Paraguayans are Immigrants from Northern Africa (94.7%, a difference of 0.010%), Panamanian (94.7%, a difference of 0.010%), Sudanese (94.7%, a difference of 0.020%), Assyrian/Chaldean/Syriac (94.7%, a difference of 0.020%), and Marshallese (94.7%, a difference of 0.020%).
| Demographics | Rating | Rank | 9th Grade |
| Hopi | 37.1 /100 | #186 | Fair 94.8% |
| Guamanians/Chamorros | 35.5 /100 | #187 | Fair 94.8% |
| Immigrants | Albania | 34.5 /100 | #188 | Fair 94.8% |
| Immigrants | Argentina | 34.4 /100 | #189 | Fair 94.8% |
| Sudanese | 32.7 /100 | #190 | Fair 94.7% |
| Assyrians/Chaldeans/Syriacs | 32.0 /100 | #191 | Fair 94.7% |
| Immigrants | Northern Africa | 30.7 /100 | #192 | Fair 94.7% |
| Paraguayans | 30.1 /100 | #193 | Fair 94.7% |
| Panamanians | 29.0 /100 | #194 | Fair 94.7% |
| Marshallese | 27.9 /100 | #195 | Fair 94.7% |
| Immigrants | Lebanon | 27.2 /100 | #196 | Fair 94.7% |
| Immigrants | Micronesia | 24.7 /100 | #197 | Fair 94.7% |
| Hawaiians | 22.7 /100 | #198 | Fair 94.7% |
| Laotians | 21.0 /100 | #199 | Fair 94.6% |
| Immigrants | Zaire | 20.6 /100 | #200 | Fair 94.6% |
Demographics Similar to Mexican American Indians by 9th Grade
In terms of 9th grade, the demographic groups most similar to Mexican American Indians are Hispanic or Latino (90.9%, a difference of 0.020%), Immigrants from Cabo Verde (90.9%, a difference of 0.030%), Immigrants from Yemen (90.8%, a difference of 0.11%), Honduran (91.0%, a difference of 0.15%), and Immigrants from the Azores (90.8%, a difference of 0.16%).
| Demographics | Rating | Rank | 9th Grade |
| Immigrants | Belize | 0.0 /100 | #324 | Tragic 91.8% |
| Central American Indians | 0.0 /100 | #325 | Tragic 91.5% |
| Immigrants | Armenia | 0.0 /100 | #326 | Tragic 91.4% |
| Immigrants | Nicaragua | 0.0 /100 | #327 | Tragic 91.3% |
| Dominicans | 0.0 /100 | #328 | Tragic 91.1% |
| Hondurans | 0.0 /100 | #329 | Tragic 91.0% |
| Immigrants | Cabo Verde | 0.0 /100 | #330 | Tragic 90.9% |
| Mexican American Indians | 0.0 /100 | #331 | Tragic 90.9% |
| Hispanics or Latinos | 0.0 /100 | #332 | Tragic 90.9% |
| Immigrants | Yemen | 0.0 /100 | #333 | Tragic 90.8% |
| Immigrants | Azores | 0.0 /100 | #334 | Tragic 90.8% |
| Immigrants | Honduras | 0.0 /100 | #335 | Tragic 90.6% |
| Immigrants | Dominican Republic | 0.0 /100 | #336 | Tragic 90.5% |
| Immigrants | Latin America | 0.0 /100 | #337 | Tragic 90.4% |
| Central Americans | 0.0 /100 | #338 | Tragic 90.4% |