Panamanian vs Bhutanese Unemployment Among Women with Children Under 6 years
COMPARE
Panamanian
Bhutanese
Unemployment Among Women with Children Under 6 years
Unemployment Among Women with Children Under 6 years Comparison
Panamanians
Bhutanese
7.6%
UNEMPLOYMENT AMONG WOMEN WITH CHILDREN UNDER 6 YEARS
49.6/ 100
METRIC RATING
175th/ 347
METRIC RANK
6.7%
UNEMPLOYMENT AMONG WOMEN WITH CHILDREN UNDER 6 YEARS
99.9/ 100
METRIC RATING
43rd/ 347
METRIC RANK
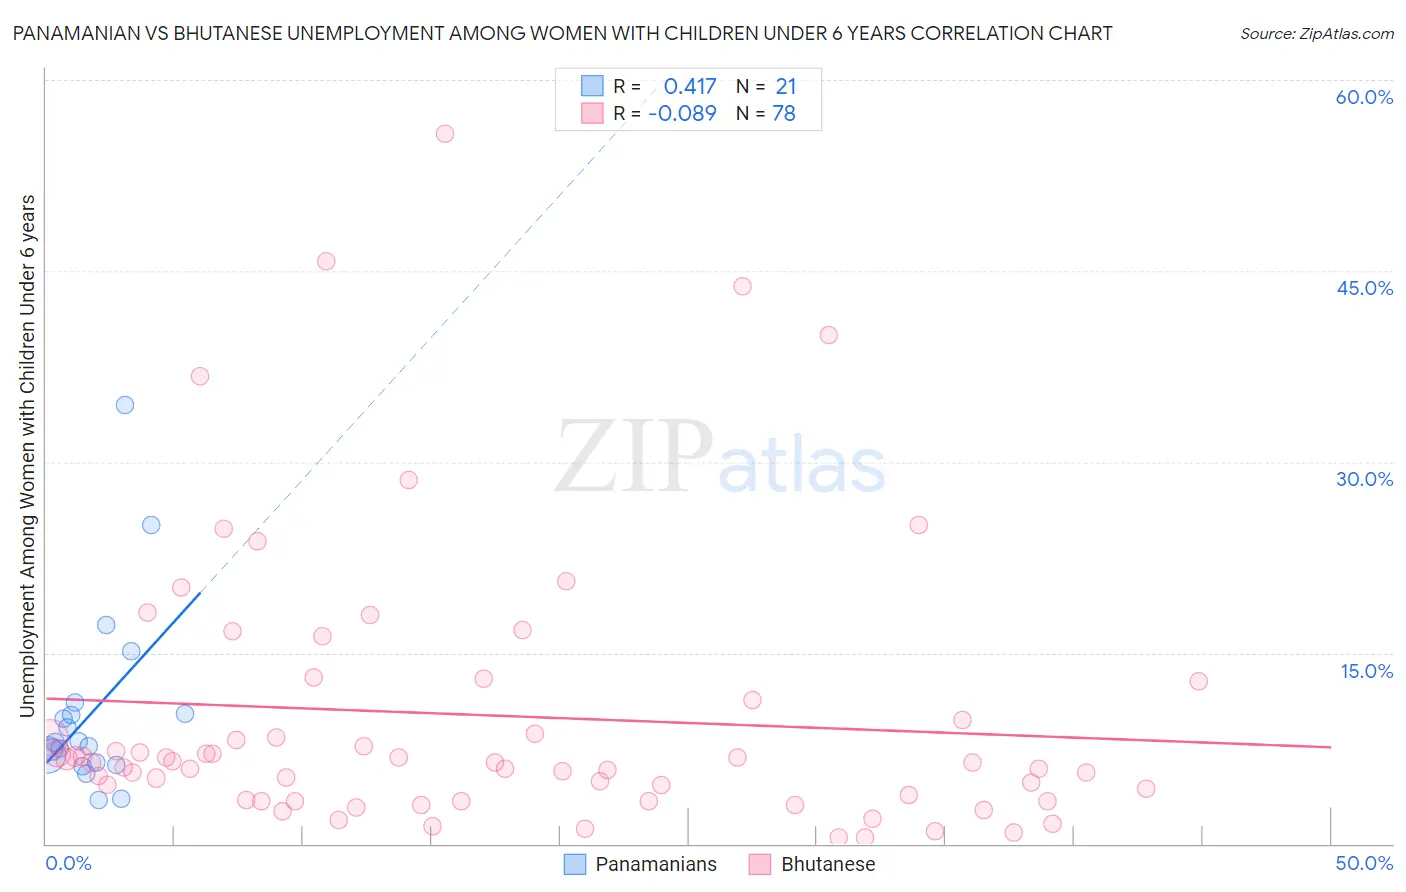
Panamanian vs Bhutanese Unemployment Among Women with Children Under 6 years Correlation Chart
The statistical analysis conducted on geographies consisting of 233,067,196 people shows a moderate positive correlation between the proportion of Panamanians and unemployment rate among women with children under the age of 6 in the United States with a correlation coefficient (R) of 0.417 and weighted average of 7.6%. Similarly, the statistical analysis conducted on geographies consisting of 334,834,732 people shows a slight negative correlation between the proportion of Bhutanese and unemployment rate among women with children under the age of 6 in the United States with a correlation coefficient (R) of -0.089 and weighted average of 6.7%, a difference of 14.0%.
Unemployment Among Women with Children Under 6 years Correlation Summary
| Measurement | Panamanian | Bhutanese |
| Minimum | 3.4% | 0.50% |
| Maximum | 34.5% | 55.8% |
| Range | 31.0% | 55.3% |
| Mean | 10.4% | 10.1% |
| Median | 7.9% | 6.4% |
| Interquartile 25% (IQ1) | 6.3% | 3.4% |
| Interquartile 75% (IQ3) | 10.7% | 11.3% |
| Interquartile Range (IQR) | 4.4% | 7.9% |
| Standard Deviation (Sample) | 7.4% | 11.0% |
| Standard Deviation (Population) | 7.2% | 11.0% |
Similar Demographics by Unemployment Among Women with Children Under 6 years
Demographics Similar to Panamanians by Unemployment Among Women with Children Under 6 years
In terms of unemployment among women with children under 6 years, the demographic groups most similar to Panamanians are Immigrants from Laos (7.6%, a difference of 0.020%), Cree (7.6%, a difference of 0.13%), Puget Sound Salish (7.7%, a difference of 0.13%), Austrian (7.7%, a difference of 0.24%), and Immigrants from England (7.7%, a difference of 0.28%).
| Demographics | Rating | Rank | Unemployment Among Women with Children Under 6 years |
| Immigrants | Canada | 61.6 /100 | #168 | Good 7.6% |
| Immigrants | Scotland | 61.3 /100 | #169 | Good 7.6% |
| Czechs | 59.8 /100 | #170 | Average 7.6% |
| Immigrants | Grenada | 59.0 /100 | #171 | Average 7.6% |
| Immigrants | North America | 57.7 /100 | #172 | Average 7.6% |
| Cree | 51.6 /100 | #173 | Average 7.6% |
| Immigrants | Laos | 50.0 /100 | #174 | Average 7.6% |
| Panamanians | 49.6 /100 | #175 | Average 7.6% |
| Puget Sound Salish | 47.7 /100 | #176 | Average 7.7% |
| Austrians | 46.0 /100 | #177 | Average 7.7% |
| Immigrants | England | 45.4 /100 | #178 | Average 7.7% |
| Immigrants | Western Europe | 44.9 /100 | #179 | Average 7.7% |
| Immigrants | Uruguay | 44.5 /100 | #180 | Average 7.7% |
| Brazilians | 43.9 /100 | #181 | Average 7.7% |
| Nepalese | 43.5 /100 | #182 | Average 7.7% |
Demographics Similar to Bhutanese by Unemployment Among Women with Children Under 6 years
In terms of unemployment among women with children under 6 years, the demographic groups most similar to Bhutanese are Immigrants from Cuba (6.7%, a difference of 0.28%), Immigrants from Indonesia (6.7%, a difference of 0.38%), Asian (6.7%, a difference of 0.54%), Iranian (6.7%, a difference of 0.55%), and Immigrants from Australia (6.8%, a difference of 0.61%).
| Demographics | Rating | Rank | Unemployment Among Women with Children Under 6 years |
| Luxembourgers | 100.0 /100 | #36 | Exceptional 6.6% |
| Sri Lankans | 100.0 /100 | #37 | Exceptional 6.6% |
| Hmong | 100.0 /100 | #38 | Exceptional 6.7% |
| Immigrants | Russia | 100.0 /100 | #39 | Exceptional 6.7% |
| Asians | 100.0 /100 | #40 | Exceptional 6.7% |
| Immigrants | Indonesia | 99.9 /100 | #41 | Exceptional 6.7% |
| Immigrants | Cuba | 99.9 /100 | #42 | Exceptional 6.7% |
| Bhutanese | 99.9 /100 | #43 | Exceptional 6.7% |
| Iranians | 99.9 /100 | #44 | Exceptional 6.7% |
| Immigrants | Australia | 99.9 /100 | #45 | Exceptional 6.8% |
| Latvians | 99.9 /100 | #46 | Exceptional 6.8% |
| Immigrants | Asia | 99.9 /100 | #47 | Exceptional 6.8% |
| Immigrants | Switzerland | 99.9 /100 | #48 | Exceptional 6.8% |
| Immigrants | Nepal | 99.9 /100 | #49 | Exceptional 6.8% |
| Immigrants | Ireland | 99.9 /100 | #50 | Exceptional 6.8% |