Pakistani vs Slavic Child Poverty Under the Age of 5
COMPARE
Pakistani
Slavic
Child Poverty Under the Age of 5
Child Poverty Under the Age of 5 Comparison
Pakistanis
Slavs
16.0%
CHILD POVERTY UNDER THE AGE OF 5
94.2/ 100
METRIC RATING
111th/ 347
METRIC RANK
17.0%
CHILD POVERTY UNDER THE AGE OF 5
64.0/ 100
METRIC RATING
166th/ 347
METRIC RANK
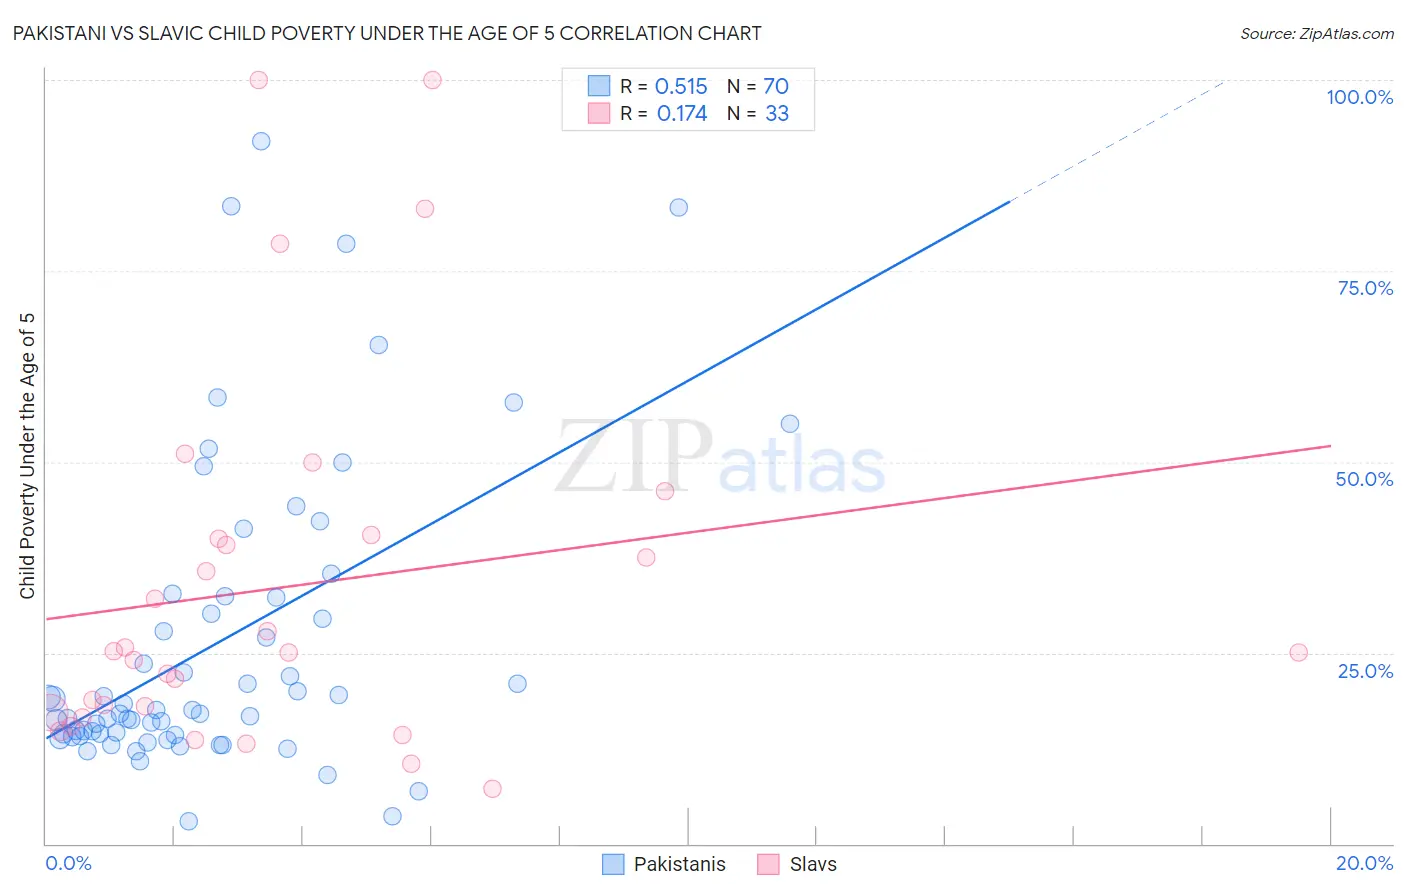
Pakistani vs Slavic Child Poverty Under the Age of 5 Correlation Chart
The statistical analysis conducted on geographies consisting of 324,820,623 people shows a substantial positive correlation between the proportion of Pakistanis and poverty level among children under the age of 5 in the United States with a correlation coefficient (R) of 0.515 and weighted average of 16.0%. Similarly, the statistical analysis conducted on geographies consisting of 261,045,487 people shows a poor positive correlation between the proportion of Slavs and poverty level among children under the age of 5 in the United States with a correlation coefficient (R) of 0.174 and weighted average of 17.0%, a difference of 6.2%.
Child Poverty Under the Age of 5 Correlation Summary
| Measurement | Pakistani | Slavic |
| Minimum | 3.0% | 7.2% |
| Maximum | 92.0% | 100.0% |
| Range | 89.0% | 92.8% |
| Mean | 26.2% | 33.6% |
| Median | 17.3% | 25.0% |
| Interquartile 25% (IQ1) | 14.3% | 16.9% |
| Interquartile 75% (IQ3) | 32.3% | 40.2% |
| Interquartile Range (IQR) | 18.0% | 23.3% |
| Standard Deviation (Sample) | 19.9% | 24.5% |
| Standard Deviation (Population) | 19.8% | 24.1% |
Similar Demographics by Child Poverty Under the Age of 5
Demographics Similar to Pakistanis by Child Poverty Under the Age of 5
In terms of child poverty under the age of 5, the demographic groups most similar to Pakistanis are Northern European (16.0%, a difference of 0.040%), Romanian (16.0%, a difference of 0.040%), Peruvian (16.0%, a difference of 0.050%), Puget Sound Salish (16.0%, a difference of 0.060%), and Immigrants from Brazil (16.0%, a difference of 0.12%).
| Demographics | Rating | Rank | Child Poverty Under the Age of 5 |
| Immigrants | North America | 94.9 /100 | #104 | Exceptional 15.9% |
| Immigrants | Spain | 94.8 /100 | #105 | Exceptional 15.9% |
| Tlingit-Haida | 94.7 /100 | #106 | Exceptional 15.9% |
| Slovenes | 94.4 /100 | #107 | Exceptional 16.0% |
| Immigrants | Brazil | 94.4 /100 | #108 | Exceptional 16.0% |
| Northern Europeans | 94.3 /100 | #109 | Exceptional 16.0% |
| Romanians | 94.3 /100 | #110 | Exceptional 16.0% |
| Pakistanis | 94.2 /100 | #111 | Exceptional 16.0% |
| Peruvians | 94.1 /100 | #112 | Exceptional 16.0% |
| Puget Sound Salish | 94.1 /100 | #113 | Exceptional 16.0% |
| Immigrants | Kuwait | 93.9 /100 | #114 | Exceptional 16.0% |
| Albanians | 93.8 /100 | #115 | Exceptional 16.0% |
| Immigrants | Austria | 93.5 /100 | #116 | Exceptional 16.0% |
| Basques | 93.4 /100 | #117 | Exceptional 16.0% |
| Immigrants | Denmark | 93.4 /100 | #118 | Exceptional 16.0% |
Demographics Similar to Slavs by Child Poverty Under the Age of 5
In terms of child poverty under the age of 5, the demographic groups most similar to Slavs are Immigrants from Uzbekistan (17.0%, a difference of 0.22%), Immigrants from Colombia (16.9%, a difference of 0.34%), Uruguayan (17.0%, a difference of 0.39%), Immigrants from Oceania (16.9%, a difference of 0.43%), and Immigrants from South America (17.1%, a difference of 0.44%).
| Demographics | Rating | Rank | Child Poverty Under the Age of 5 |
| Immigrants | Syria | 72.3 /100 | #159 | Good 16.8% |
| Irish | 72.0 /100 | #160 | Good 16.8% |
| English | 70.4 /100 | #161 | Good 16.8% |
| Costa Ricans | 69.8 /100 | #162 | Good 16.9% |
| Scottish | 68.6 /100 | #163 | Good 16.9% |
| Immigrants | Oceania | 67.6 /100 | #164 | Good 16.9% |
| Immigrants | Colombia | 66.9 /100 | #165 | Good 16.9% |
| Slavs | 64.0 /100 | #166 | Good 17.0% |
| Immigrants | Uzbekistan | 62.0 /100 | #167 | Good 17.0% |
| Uruguayans | 60.5 /100 | #168 | Good 17.0% |
| Immigrants | South America | 60.0 /100 | #169 | Good 17.1% |
| Immigrants | Western Asia | 59.2 /100 | #170 | Average 17.1% |
| Immigrants | Morocco | 58.9 /100 | #171 | Average 17.1% |
| Yugoslavians | 54.1 /100 | #172 | Average 17.2% |
| Welsh | 54.0 /100 | #173 | Average 17.2% |