Pakistani vs Pennsylvania German Child Poverty Under the Age of 5
COMPARE
Pakistani
Pennsylvania German
Child Poverty Under the Age of 5
Child Poverty Under the Age of 5 Comparison
Pakistanis
Pennsylvania Germans
16.0%
CHILD POVERTY UNDER THE AGE OF 5
94.2/ 100
METRIC RATING
111th/ 347
METRIC RANK
19.8%
CHILD POVERTY UNDER THE AGE OF 5
0.3/ 100
METRIC RATING
251st/ 347
METRIC RANK
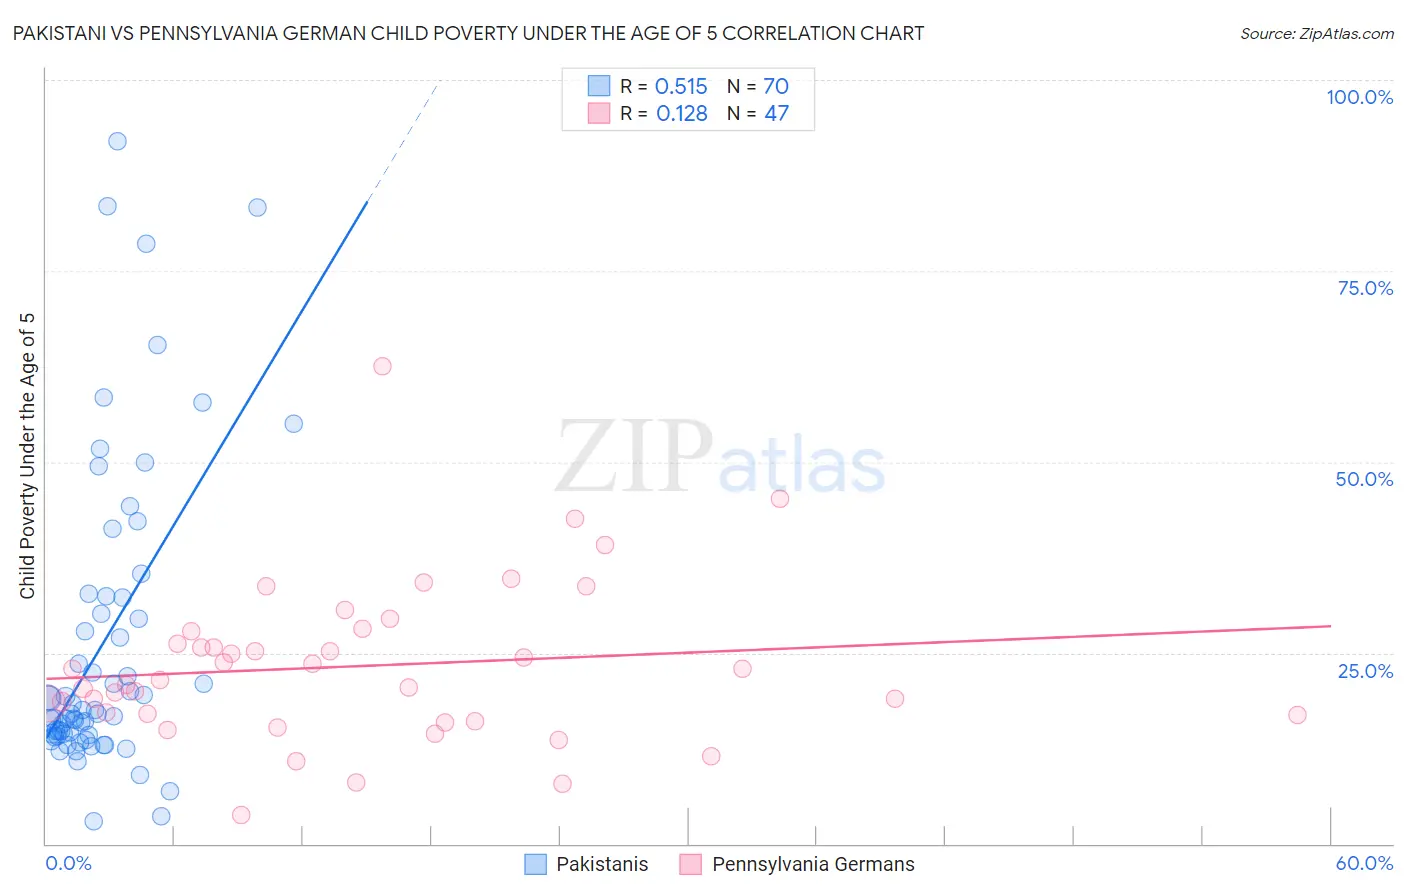
Pakistani vs Pennsylvania German Child Poverty Under the Age of 5 Correlation Chart
The statistical analysis conducted on geographies consisting of 324,820,623 people shows a substantial positive correlation between the proportion of Pakistanis and poverty level among children under the age of 5 in the United States with a correlation coefficient (R) of 0.515 and weighted average of 16.0%. Similarly, the statistical analysis conducted on geographies consisting of 226,788,326 people shows a poor positive correlation between the proportion of Pennsylvania Germans and poverty level among children under the age of 5 in the United States with a correlation coefficient (R) of 0.128 and weighted average of 19.8%, a difference of 23.7%.
Child Poverty Under the Age of 5 Correlation Summary
| Measurement | Pakistani | Pennsylvania German |
| Minimum | 3.0% | 3.8% |
| Maximum | 92.0% | 62.5% |
| Range | 89.0% | 58.7% |
| Mean | 26.2% | 23.3% |
| Median | 17.3% | 21.4% |
| Interquartile 25% (IQ1) | 14.3% | 16.9% |
| Interquartile 75% (IQ3) | 32.3% | 27.8% |
| Interquartile Range (IQR) | 18.0% | 10.9% |
| Standard Deviation (Sample) | 19.9% | 10.5% |
| Standard Deviation (Population) | 19.8% | 10.4% |
Similar Demographics by Child Poverty Under the Age of 5
Demographics Similar to Pakistanis by Child Poverty Under the Age of 5
In terms of child poverty under the age of 5, the demographic groups most similar to Pakistanis are Northern European (16.0%, a difference of 0.040%), Romanian (16.0%, a difference of 0.040%), Peruvian (16.0%, a difference of 0.050%), Puget Sound Salish (16.0%, a difference of 0.060%), and Immigrants from Brazil (16.0%, a difference of 0.12%).
| Demographics | Rating | Rank | Child Poverty Under the Age of 5 |
| Immigrants | North America | 94.9 /100 | #104 | Exceptional 15.9% |
| Immigrants | Spain | 94.8 /100 | #105 | Exceptional 15.9% |
| Tlingit-Haida | 94.7 /100 | #106 | Exceptional 15.9% |
| Slovenes | 94.4 /100 | #107 | Exceptional 16.0% |
| Immigrants | Brazil | 94.4 /100 | #108 | Exceptional 16.0% |
| Northern Europeans | 94.3 /100 | #109 | Exceptional 16.0% |
| Romanians | 94.3 /100 | #110 | Exceptional 16.0% |
| Pakistanis | 94.2 /100 | #111 | Exceptional 16.0% |
| Peruvians | 94.1 /100 | #112 | Exceptional 16.0% |
| Puget Sound Salish | 94.1 /100 | #113 | Exceptional 16.0% |
| Immigrants | Kuwait | 93.9 /100 | #114 | Exceptional 16.0% |
| Albanians | 93.8 /100 | #115 | Exceptional 16.0% |
| Immigrants | Austria | 93.5 /100 | #116 | Exceptional 16.0% |
| Basques | 93.4 /100 | #117 | Exceptional 16.0% |
| Immigrants | Denmark | 93.4 /100 | #118 | Exceptional 16.0% |
Demographics Similar to Pennsylvania Germans by Child Poverty Under the Age of 5
In terms of child poverty under the age of 5, the demographic groups most similar to Pennsylvania Germans are Immigrants from Nicaragua (19.8%, a difference of 0.040%), Nonimmigrants (19.7%, a difference of 0.17%), Immigrants from Middle Africa (19.7%, a difference of 0.22%), Marshallese (19.7%, a difference of 0.24%), and Guyanese (19.7%, a difference of 0.26%).
| Demographics | Rating | Rank | Child Poverty Under the Age of 5 |
| Immigrants | Ghana | 0.5 /100 | #244 | Tragic 19.6% |
| Immigrants | Western Africa | 0.4 /100 | #245 | Tragic 19.7% |
| Cree | 0.4 /100 | #246 | Tragic 19.7% |
| Guyanese | 0.4 /100 | #247 | Tragic 19.7% |
| Marshallese | 0.4 /100 | #248 | Tragic 19.7% |
| Immigrants | Middle Africa | 0.4 /100 | #249 | Tragic 19.7% |
| Immigrants | Nonimmigrants | 0.4 /100 | #250 | Tragic 19.7% |
| Pennsylvania Germans | 0.3 /100 | #251 | Tragic 19.8% |
| Immigrants | Nicaragua | 0.3 /100 | #252 | Tragic 19.8% |
| Mexican American Indians | 0.3 /100 | #253 | Tragic 19.9% |
| Fijians | 0.3 /100 | #254 | Tragic 19.9% |
| Immigrants | Cuba | 0.2 /100 | #255 | Tragic 19.9% |
| Immigrants | Barbados | 0.2 /100 | #256 | Tragic 20.0% |
| Shoshone | 0.2 /100 | #257 | Tragic 20.0% |
| Immigrants | St. Vincent and the Grenadines | 0.2 /100 | #258 | Tragic 20.0% |