Immigrants from Yemen vs Immigrants from Mexico Female Poverty Among 18-24 Year Olds
COMPARE
Immigrants from Yemen
Immigrants from Mexico
Female Poverty Among 18-24 Year Olds
Female Poverty Among 18-24 Year Olds Comparison
Immigrants from Yemen
Immigrants from Mexico
27.5%
FEMALE POVERTY AMONG 18-24 YEAR OLDS
0.0/ 100
METRIC RATING
336th/ 347
METRIC RANK
20.2%
FEMALE POVERTY AMONG 18-24 YEAR OLDS
36.3/ 100
METRIC RATING
187th/ 347
METRIC RANK
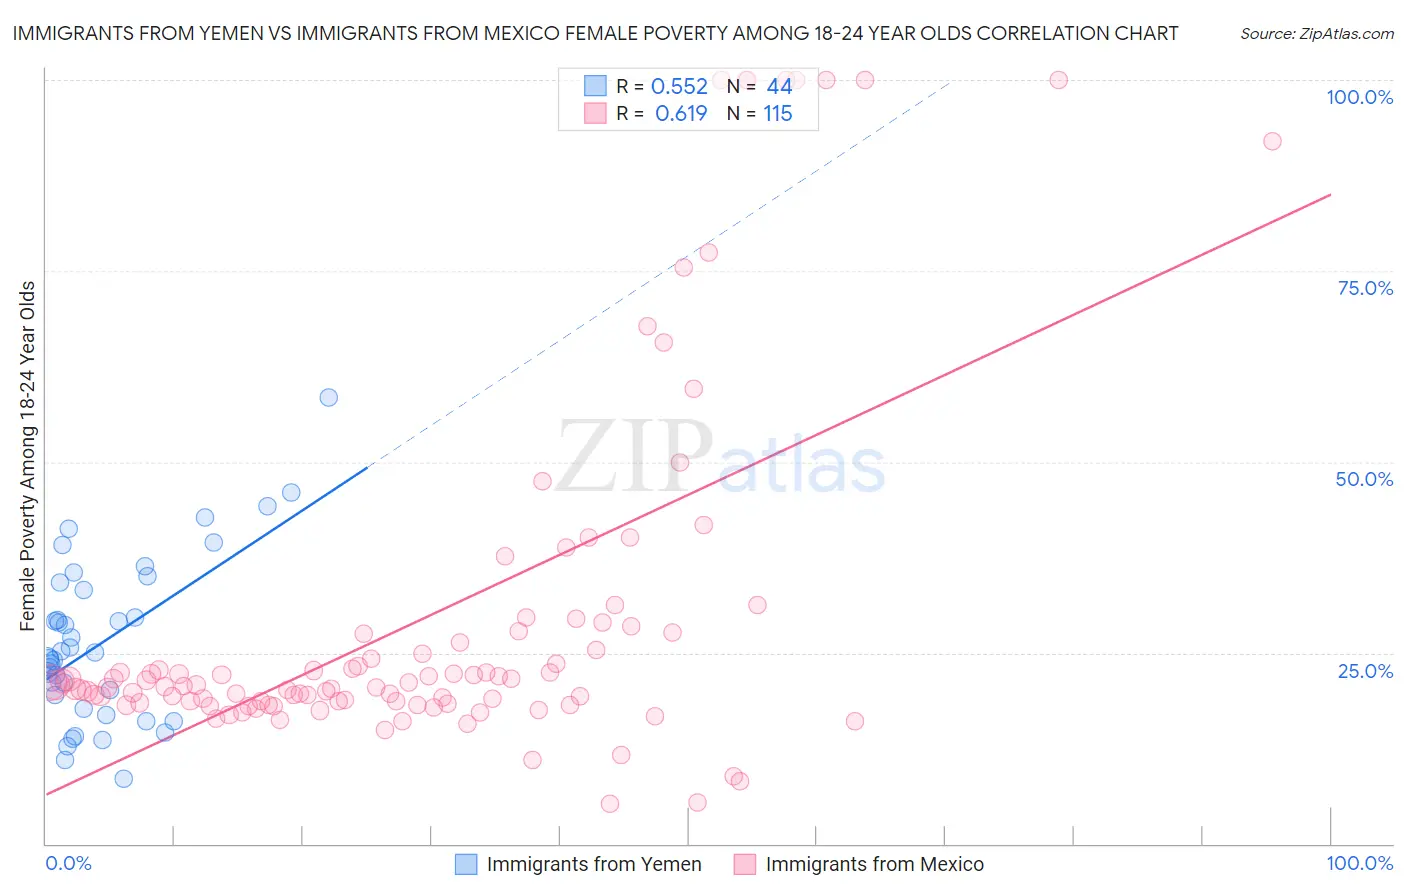
Immigrants from Yemen vs Immigrants from Mexico Female Poverty Among 18-24 Year Olds Correlation Chart
The statistical analysis conducted on geographies consisting of 82,141,466 people shows a substantial positive correlation between the proportion of Immigrants from Yemen and poverty level among females between the ages 18 and 24 in the United States with a correlation coefficient (R) of 0.552 and weighted average of 27.5%. Similarly, the statistical analysis conducted on geographies consisting of 494,801,029 people shows a significant positive correlation between the proportion of Immigrants from Mexico and poverty level among females between the ages 18 and 24 in the United States with a correlation coefficient (R) of 0.619 and weighted average of 20.2%, a difference of 36.1%.
Female Poverty Among 18-24 Year Olds Correlation Summary
| Measurement | Immigrants from Yemen | Immigrants from Mexico |
| Minimum | 8.5% | 5.3% |
| Maximum | 58.5% | 100.0% |
| Range | 49.9% | 94.7% |
| Mean | 26.4% | 29.8% |
| Median | 24.6% | 20.8% |
| Interquartile 25% (IQ1) | 18.6% | 18.5% |
| Interquartile 75% (IQ3) | 33.7% | 27.7% |
| Interquartile Range (IQR) | 15.1% | 9.2% |
| Standard Deviation (Sample) | 10.7% | 23.6% |
| Standard Deviation (Population) | 10.6% | 23.5% |
Similar Demographics by Female Poverty Among 18-24 Year Olds
Demographics Similar to Immigrants from Yemen by Female Poverty Among 18-24 Year Olds
In terms of female poverty among 18-24 year olds, the demographic groups most similar to Immigrants from Yemen are Yup'ik (27.0%, a difference of 1.9%), Cheyenne (28.1%, a difference of 2.2%), Hopi (28.2%, a difference of 2.4%), Pueblo (26.9%, a difference of 2.4%), and Pima (28.4%, a difference of 3.1%).
| Demographics | Rating | Rank | Female Poverty Among 18-24 Year Olds |
| Cajuns | 0.0 /100 | #329 | Tragic 25.7% |
| Immigrants | Somalia | 0.0 /100 | #330 | Tragic 25.7% |
| Chippewa | 0.0 /100 | #331 | Tragic 25.9% |
| Houma | 0.0 /100 | #332 | Tragic 26.2% |
| Apache | 0.0 /100 | #333 | Tragic 26.3% |
| Pueblo | 0.0 /100 | #334 | Tragic 26.9% |
| Yup'ik | 0.0 /100 | #335 | Tragic 27.0% |
| Immigrants | Yemen | 0.0 /100 | #336 | Tragic 27.5% |
| Cheyenne | 0.0 /100 | #337 | Tragic 28.1% |
| Hopi | 0.0 /100 | #338 | Tragic 28.2% |
| Pima | 0.0 /100 | #339 | Tragic 28.4% |
| Sioux | 0.0 /100 | #340 | Tragic 28.6% |
| Colville | 0.0 /100 | #341 | Tragic 29.0% |
| Kiowa | 0.0 /100 | #342 | Tragic 29.2% |
| Puerto Ricans | 0.0 /100 | #343 | Tragic 29.8% |
Demographics Similar to Immigrants from Mexico by Female Poverty Among 18-24 Year Olds
In terms of female poverty among 18-24 year olds, the demographic groups most similar to Immigrants from Mexico are Immigrants from Ethiopia (20.2%, a difference of 0.050%), Scandinavian (20.3%, a difference of 0.090%), Immigrants from Germany (20.3%, a difference of 0.12%), Nepalese (20.2%, a difference of 0.17%), and Immigrants from Central America (20.2%, a difference of 0.19%).
| Demographics | Rating | Rank | Female Poverty Among 18-24 Year Olds |
| Iraqis | 43.3 /100 | #180 | Average 20.2% |
| Immigrants | China | 43.0 /100 | #181 | Average 20.2% |
| Immigrants | Barbados | 42.8 /100 | #182 | Average 20.2% |
| Lebanese | 40.6 /100 | #183 | Average 20.2% |
| Immigrants | Central America | 39.9 /100 | #184 | Fair 20.2% |
| Nepalese | 39.7 /100 | #185 | Fair 20.2% |
| Immigrants | Ethiopia | 37.3 /100 | #186 | Fair 20.2% |
| Immigrants | Mexico | 36.3 /100 | #187 | Fair 20.2% |
| Scandinavians | 34.6 /100 | #188 | Fair 20.3% |
| Immigrants | Germany | 34.0 /100 | #189 | Fair 20.3% |
| Immigrants | Western Asia | 29.3 /100 | #190 | Fair 20.3% |
| Moroccans | 25.8 /100 | #191 | Fair 20.4% |
| Immigrants | Israel | 24.4 /100 | #192 | Fair 20.4% |
| Nigerians | 23.4 /100 | #193 | Fair 20.4% |
| Mexican American Indians | 23.2 /100 | #194 | Fair 20.4% |