Paiute vs Immigrants from West Indies Single Father Poverty
COMPARE
Paiute
Immigrants from West Indies
Single Father Poverty
Single Father Poverty Comparison
Paiute
Immigrants from West Indies
21.6%
SINGLE FATHER POVERTY
0.0/ 100
METRIC RATING
330th/ 347
METRIC RANK
15.9%
SINGLE FATHER POVERTY
90.8/ 100
METRIC RATING
129th/ 347
METRIC RANK
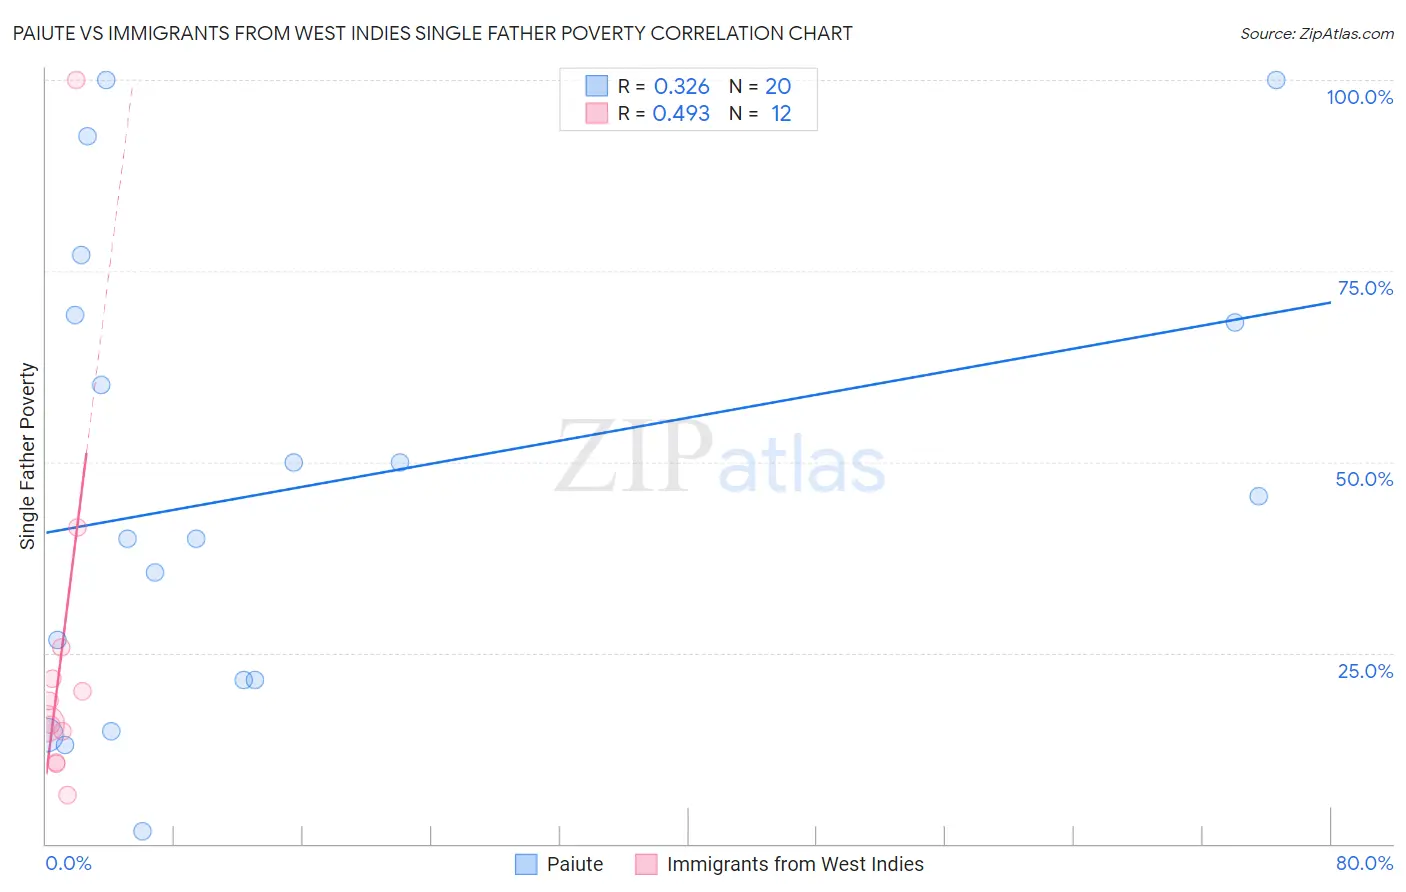
Paiute vs Immigrants from West Indies Single Father Poverty Correlation Chart
The statistical analysis conducted on geographies consisting of 54,887,745 people shows a mild positive correlation between the proportion of Paiute and poverty level among single fathers in the United States with a correlation coefficient (R) of 0.326 and weighted average of 21.6%. Similarly, the statistical analysis conducted on geographies consisting of 68,386,268 people shows a moderate positive correlation between the proportion of Immigrants from West Indies and poverty level among single fathers in the United States with a correlation coefficient (R) of 0.493 and weighted average of 15.9%, a difference of 36.1%.
Single Father Poverty Correlation Summary
| Measurement | Paiute | Immigrants from West Indies |
| Minimum | 1.6% | 6.4% |
| Maximum | 100.0% | 100.0% |
| Range | 98.4% | 93.6% |
| Mean | 47.1% | 25.1% |
| Median | 42.7% | 17.2% |
| Interquartile 25% (IQ1) | 21.4% | 12.7% |
| Interquartile 75% (IQ3) | 68.7% | 23.7% |
| Interquartile Range (IQR) | 47.3% | 11.0% |
| Standard Deviation (Sample) | 29.9% | 25.3% |
| Standard Deviation (Population) | 29.2% | 24.2% |
Similar Demographics by Single Father Poverty
Demographics Similar to Paiute by Single Father Poverty
In terms of single father poverty, the demographic groups most similar to Paiute are Central American Indian (21.7%, a difference of 0.27%), Colville (21.4%, a difference of 1.3%), Tohono O'odham (22.0%, a difference of 1.8%), Pueblo (21.1%, a difference of 2.4%), and Native/Alaskan (22.4%, a difference of 3.5%).
| Demographics | Rating | Rank | Single Father Poverty |
| Pennsylvania Germans | 0.0 /100 | #323 | Tragic 20.0% |
| Americans | 0.0 /100 | #324 | Tragic 20.1% |
| Blacks/African Americans | 0.0 /100 | #325 | Tragic 20.4% |
| Immigrants | Yemen | 0.0 /100 | #326 | Tragic 20.6% |
| Choctaw | 0.0 /100 | #327 | Tragic 20.7% |
| Pueblo | 0.0 /100 | #328 | Tragic 21.1% |
| Colville | 0.0 /100 | #329 | Tragic 21.4% |
| Paiute | 0.0 /100 | #330 | Tragic 21.6% |
| Central American Indians | 0.0 /100 | #331 | Tragic 21.7% |
| Tohono O'odham | 0.0 /100 | #332 | Tragic 22.0% |
| Natives/Alaskans | 0.0 /100 | #333 | Tragic 22.4% |
| Kiowa | 0.0 /100 | #334 | Tragic 22.5% |
| Shoshone | 0.0 /100 | #335 | Tragic 22.9% |
| Cajuns | 0.0 /100 | #336 | Tragic 23.1% |
| Sioux | 0.0 /100 | #337 | Tragic 23.9% |
Demographics Similar to Immigrants from West Indies by Single Father Poverty
In terms of single father poverty, the demographic groups most similar to Immigrants from West Indies are Immigrants from Nigeria (15.9%, a difference of 0.0%), Immigrants from Liberia (15.9%, a difference of 0.040%), Hmong (15.9%, a difference of 0.050%), Iraqi (15.9%, a difference of 0.060%), and Palestinian (15.9%, a difference of 0.070%).
| Demographics | Rating | Rank | Single Father Poverty |
| Sudanese | 91.6 /100 | #122 | Exceptional 15.9% |
| Palestinians | 91.3 /100 | #123 | Exceptional 15.9% |
| Immigrants | Panama | 91.3 /100 | #124 | Exceptional 15.9% |
| Iraqis | 91.2 /100 | #125 | Exceptional 15.9% |
| Hmong | 91.1 /100 | #126 | Exceptional 15.9% |
| Immigrants | Liberia | 91.1 /100 | #127 | Exceptional 15.9% |
| Immigrants | Nigeria | 90.8 /100 | #128 | Exceptional 15.9% |
| Immigrants | West Indies | 90.8 /100 | #129 | Exceptional 15.9% |
| Norwegians | 90.2 /100 | #130 | Exceptional 15.9% |
| Nicaraguans | 90.1 /100 | #131 | Exceptional 15.9% |
| Immigrants | Portugal | 89.7 /100 | #132 | Excellent 15.9% |
| Immigrants | Syria | 89.5 /100 | #133 | Excellent 15.9% |
| Immigrants | South America | 88.5 /100 | #134 | Excellent 15.9% |
| Immigrants | Sri Lanka | 88.2 /100 | #135 | Excellent 15.9% |
| Cypriots | 87.5 /100 | #136 | Excellent 15.9% |