Norwegian vs Immigrants from West Indies Single Father Poverty
COMPARE
Norwegian
Immigrants from West Indies
Single Father Poverty
Single Father Poverty Comparison
Norwegians
Immigrants from West Indies
15.9%
SINGLE FATHER POVERTY
90.2/ 100
METRIC RATING
130th/ 347
METRIC RANK
15.9%
SINGLE FATHER POVERTY
90.8/ 100
METRIC RATING
129th/ 347
METRIC RANK
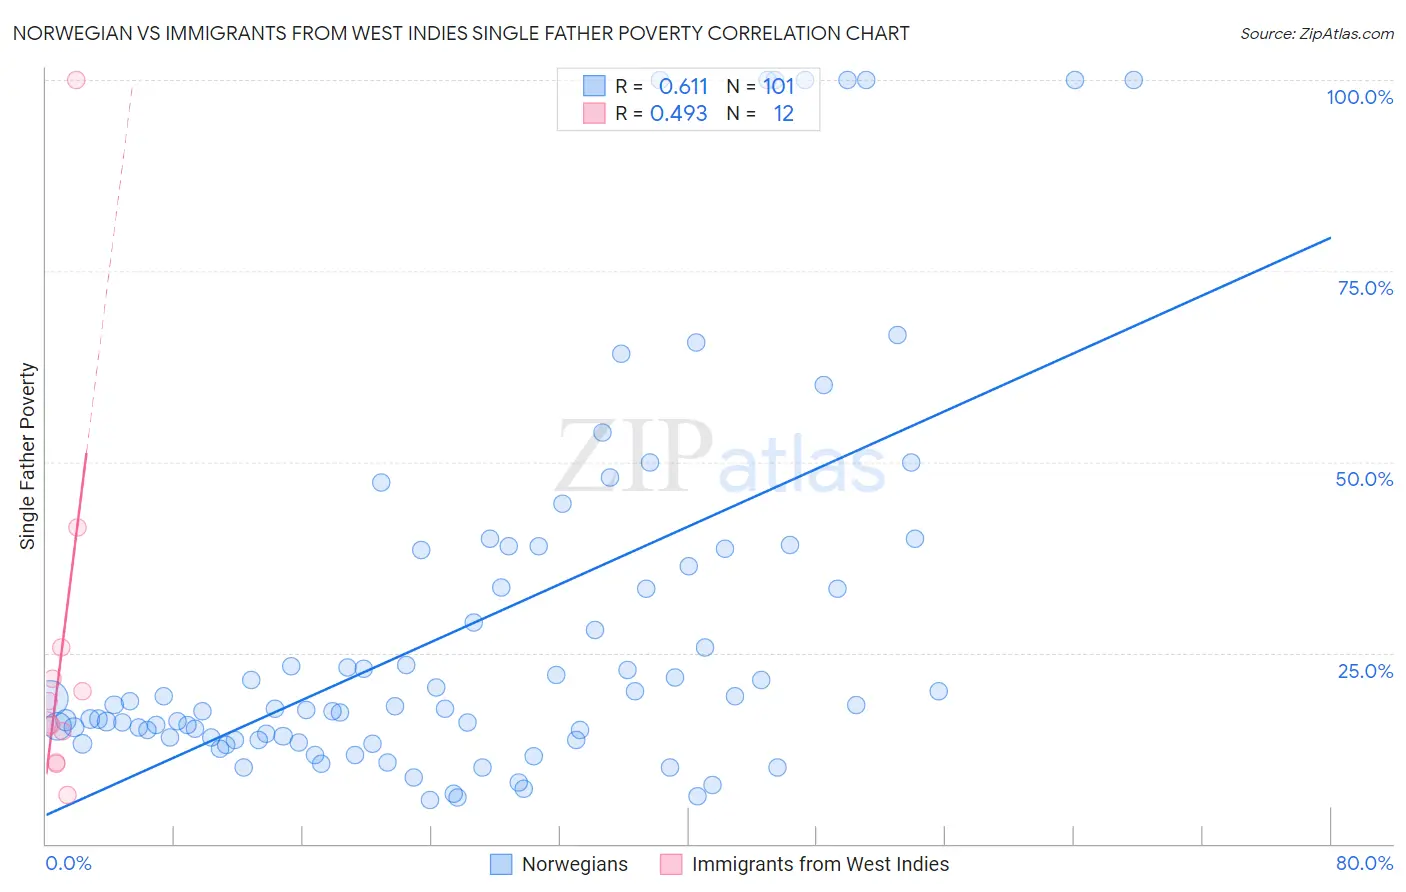
Norwegian vs Immigrants from West Indies Single Father Poverty Correlation Chart
The statistical analysis conducted on geographies consisting of 388,337,291 people shows a significant positive correlation between the proportion of Norwegians and poverty level among single fathers in the United States with a correlation coefficient (R) of 0.611 and weighted average of 15.9%. Similarly, the statistical analysis conducted on geographies consisting of 68,386,268 people shows a moderate positive correlation between the proportion of Immigrants from West Indies and poverty level among single fathers in the United States with a correlation coefficient (R) of 0.493 and weighted average of 15.9%, a difference of 0.080%.
Single Father Poverty Correlation Summary
| Measurement | Norwegian | Immigrants from West Indies |
| Minimum | 5.8% | 6.4% |
| Maximum | 100.0% | 100.0% |
| Range | 94.2% | 93.6% |
| Mean | 28.6% | 25.1% |
| Median | 17.9% | 17.2% |
| Interquartile 25% (IQ1) | 13.8% | 12.7% |
| Interquartile 75% (IQ3) | 37.4% | 23.7% |
| Interquartile Range (IQR) | 23.6% | 11.0% |
| Standard Deviation (Sample) | 25.1% | 25.3% |
| Standard Deviation (Population) | 25.0% | 24.2% |
Demographics Similar to Norwegians and Immigrants from West Indies by Single Father Poverty
In terms of single father poverty, the demographic groups most similar to Norwegians are Nicaraguan (15.9%, a difference of 0.0%), Immigrants from Portugal (15.9%, a difference of 0.060%), Immigrants from Nigeria (15.9%, a difference of 0.080%), Immigrants from Syria (15.9%, a difference of 0.080%), and Immigrants from Liberia (15.9%, a difference of 0.12%). Similarly, the demographic groups most similar to Immigrants from West Indies are Immigrants from Nigeria (15.9%, a difference of 0.0%), Immigrants from Liberia (15.9%, a difference of 0.040%), Hmong (15.9%, a difference of 0.050%), Iraqi (15.9%, a difference of 0.060%), and Palestinian (15.9%, a difference of 0.070%).
| Demographics | Rating | Rank | Single Father Poverty |
| Immigrants | Belarus | 92.4 /100 | #119 | Exceptional 15.8% |
| Uruguayans | 92.1 /100 | #120 | Exceptional 15.9% |
| Immigrants | Immigrants | 91.9 /100 | #121 | Exceptional 15.9% |
| Sudanese | 91.6 /100 | #122 | Exceptional 15.9% |
| Palestinians | 91.3 /100 | #123 | Exceptional 15.9% |
| Immigrants | Panama | 91.3 /100 | #124 | Exceptional 15.9% |
| Iraqis | 91.2 /100 | #125 | Exceptional 15.9% |
| Hmong | 91.1 /100 | #126 | Exceptional 15.9% |
| Immigrants | Liberia | 91.1 /100 | #127 | Exceptional 15.9% |
| Immigrants | Nigeria | 90.8 /100 | #128 | Exceptional 15.9% |
| Immigrants | West Indies | 90.8 /100 | #129 | Exceptional 15.9% |
| Norwegians | 90.2 /100 | #130 | Exceptional 15.9% |
| Nicaraguans | 90.1 /100 | #131 | Exceptional 15.9% |
| Immigrants | Portugal | 89.7 /100 | #132 | Excellent 15.9% |
| Immigrants | Syria | 89.5 /100 | #133 | Excellent 15.9% |
| Immigrants | South America | 88.5 /100 | #134 | Excellent 15.9% |
| Immigrants | Sri Lanka | 88.2 /100 | #135 | Excellent 15.9% |
| Cypriots | 87.5 /100 | #136 | Excellent 15.9% |
| Immigrants | Azores | 87.2 /100 | #137 | Excellent 15.9% |
| Central Americans | 87.1 /100 | #138 | Excellent 16.0% |
| South Americans | 85.9 /100 | #139 | Excellent 16.0% |