Immigrants from Nicaragua vs Central American Seniors Poverty Over the Age of 65
COMPARE
Immigrants from Nicaragua
Central American
Seniors Poverty Over the Age of 65
Seniors Poverty Over the Age of 65 Comparison
Immigrants from Nicaragua
Central Americans
15.9%
SENIORS POVERTY OVER THE AGE OF 65
0.0/ 100
METRIC RATING
334th/ 347
METRIC RANK
13.4%
SENIORS POVERTY OVER THE AGE OF 65
0.0/ 100
METRIC RATING
283rd/ 347
METRIC RANK
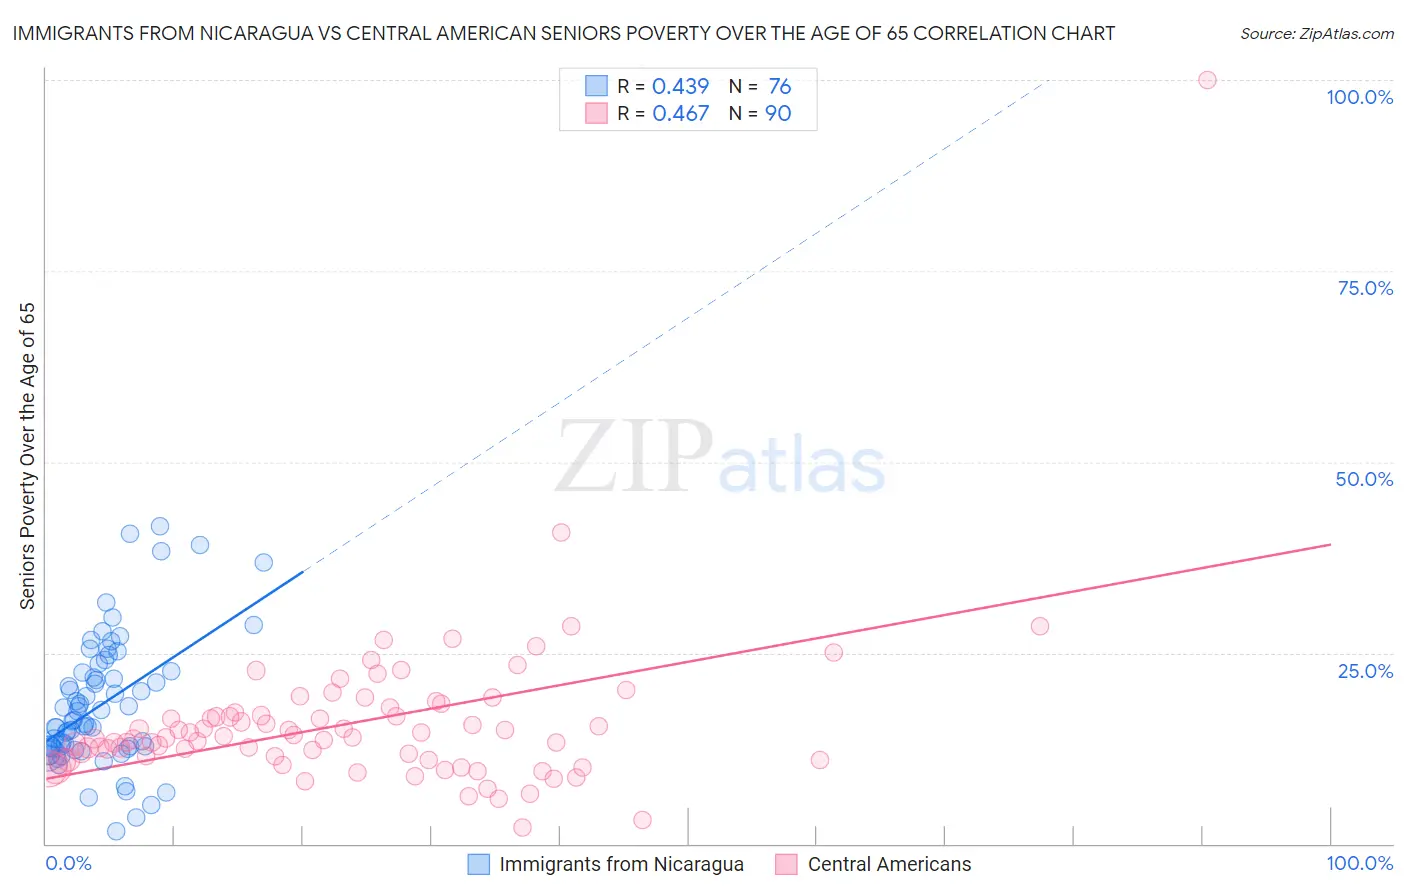
Immigrants from Nicaragua vs Central American Seniors Poverty Over the Age of 65 Correlation Chart
The statistical analysis conducted on geographies consisting of 236,090,448 people shows a moderate positive correlation between the proportion of Immigrants from Nicaragua and poverty level among seniors over the age of 65 in the United States with a correlation coefficient (R) of 0.439 and weighted average of 15.9%. Similarly, the statistical analysis conducted on geographies consisting of 501,778,259 people shows a moderate positive correlation between the proportion of Central Americans and poverty level among seniors over the age of 65 in the United States with a correlation coefficient (R) of 0.467 and weighted average of 13.4%, a difference of 18.9%.
Seniors Poverty Over the Age of 65 Correlation Summary
| Measurement | Immigrants from Nicaragua | Central American |
| Minimum | 1.7% | 2.1% |
| Maximum | 41.6% | 100.0% |
| Range | 39.9% | 97.9% |
| Mean | 18.2% | 15.8% |
| Median | 16.2% | 13.9% |
| Interquartile 25% (IQ1) | 12.6% | 11.0% |
| Interquartile 75% (IQ3) | 22.5% | 17.2% |
| Interquartile Range (IQR) | 9.9% | 6.3% |
| Standard Deviation (Sample) | 8.5% | 10.8% |
| Standard Deviation (Population) | 8.4% | 10.8% |
Similar Demographics by Seniors Poverty Over the Age of 65
Demographics Similar to Immigrants from Nicaragua by Seniors Poverty Over the Age of 65
In terms of seniors poverty over the age of 65, the demographic groups most similar to Immigrants from Nicaragua are Immigrants from Yemen (15.9%, a difference of 0.15%), Immigrants from Grenada (15.8%, a difference of 0.58%), Cuban (16.1%, a difference of 1.3%), Immigrants from Cabo Verde (16.2%, a difference of 1.8%), and British West Indian (15.6%, a difference of 2.0%).
| Demographics | Rating | Rank | Seniors Poverty Over the Age of 65 |
| Crow | 0.0 /100 | #327 | Tragic 15.2% |
| Sioux | 0.0 /100 | #328 | Tragic 15.3% |
| Immigrants | Dominica | 0.0 /100 | #329 | Tragic 15.5% |
| Immigrants | St. Vincent and the Grenadines | 0.0 /100 | #330 | Tragic 15.5% |
| British West Indians | 0.0 /100 | #331 | Tragic 15.6% |
| Immigrants | Grenada | 0.0 /100 | #332 | Tragic 15.8% |
| Immigrants | Yemen | 0.0 /100 | #333 | Tragic 15.9% |
| Immigrants | Nicaragua | 0.0 /100 | #334 | Tragic 15.9% |
| Cubans | 0.0 /100 | #335 | Tragic 16.1% |
| Immigrants | Cabo Verde | 0.0 /100 | #336 | Tragic 16.2% |
| Immigrants | Caribbean | 0.0 /100 | #337 | Tragic 16.5% |
| Pueblo | 0.0 /100 | #338 | Tragic 17.2% |
| Navajo | 0.0 /100 | #339 | Tragic 17.5% |
| Hopi | 0.0 /100 | #340 | Tragic 17.8% |
| Dominicans | 0.0 /100 | #341 | Tragic 17.8% |
Demographics Similar to Central Americans by Seniors Poverty Over the Age of 65
In terms of seniors poverty over the age of 65, the demographic groups most similar to Central Americans are Senegalese (13.3%, a difference of 0.82%), Colville (13.5%, a difference of 0.89%), Guatemalan (13.5%, a difference of 1.1%), Immigrants from Senegal (13.6%, a difference of 1.4%), and Immigrants from Mexico (13.6%, a difference of 1.5%).
| Demographics | Rating | Rank | Seniors Poverty Over the Age of 65 |
| Immigrants | Azores | 0.0 /100 | #276 | Tragic 12.9% |
| Paiute | 0.0 /100 | #277 | Tragic 12.9% |
| Immigrants | Bahamas | 0.0 /100 | #278 | Tragic 13.0% |
| Mexicans | 0.0 /100 | #279 | Tragic 13.1% |
| Yuman | 0.0 /100 | #280 | Tragic 13.1% |
| Immigrants | El Salvador | 0.0 /100 | #281 | Tragic 13.1% |
| Senegalese | 0.0 /100 | #282 | Tragic 13.3% |
| Central Americans | 0.0 /100 | #283 | Tragic 13.4% |
| Colville | 0.0 /100 | #284 | Tragic 13.5% |
| Guatemalans | 0.0 /100 | #285 | Tragic 13.5% |
| Immigrants | Senegal | 0.0 /100 | #286 | Tragic 13.6% |
| Immigrants | Mexico | 0.0 /100 | #287 | Tragic 13.6% |
| Belizeans | 0.0 /100 | #288 | Tragic 13.6% |
| Jamaicans | 0.0 /100 | #289 | Tragic 13.6% |
| Immigrants | Central America | 0.0 /100 | #290 | Tragic 13.6% |