Tongan vs Central American Seniors Poverty Over the Age of 65
COMPARE
Tongan
Central American
Seniors Poverty Over the Age of 65
Seniors Poverty Over the Age of 65 Comparison
Tongans
Central Americans
9.3%
SENIORS POVERTY OVER THE AGE OF 65
99.9/ 100
METRIC RATING
28th/ 347
METRIC RANK
13.4%
SENIORS POVERTY OVER THE AGE OF 65
0.0/ 100
METRIC RATING
283rd/ 347
METRIC RANK
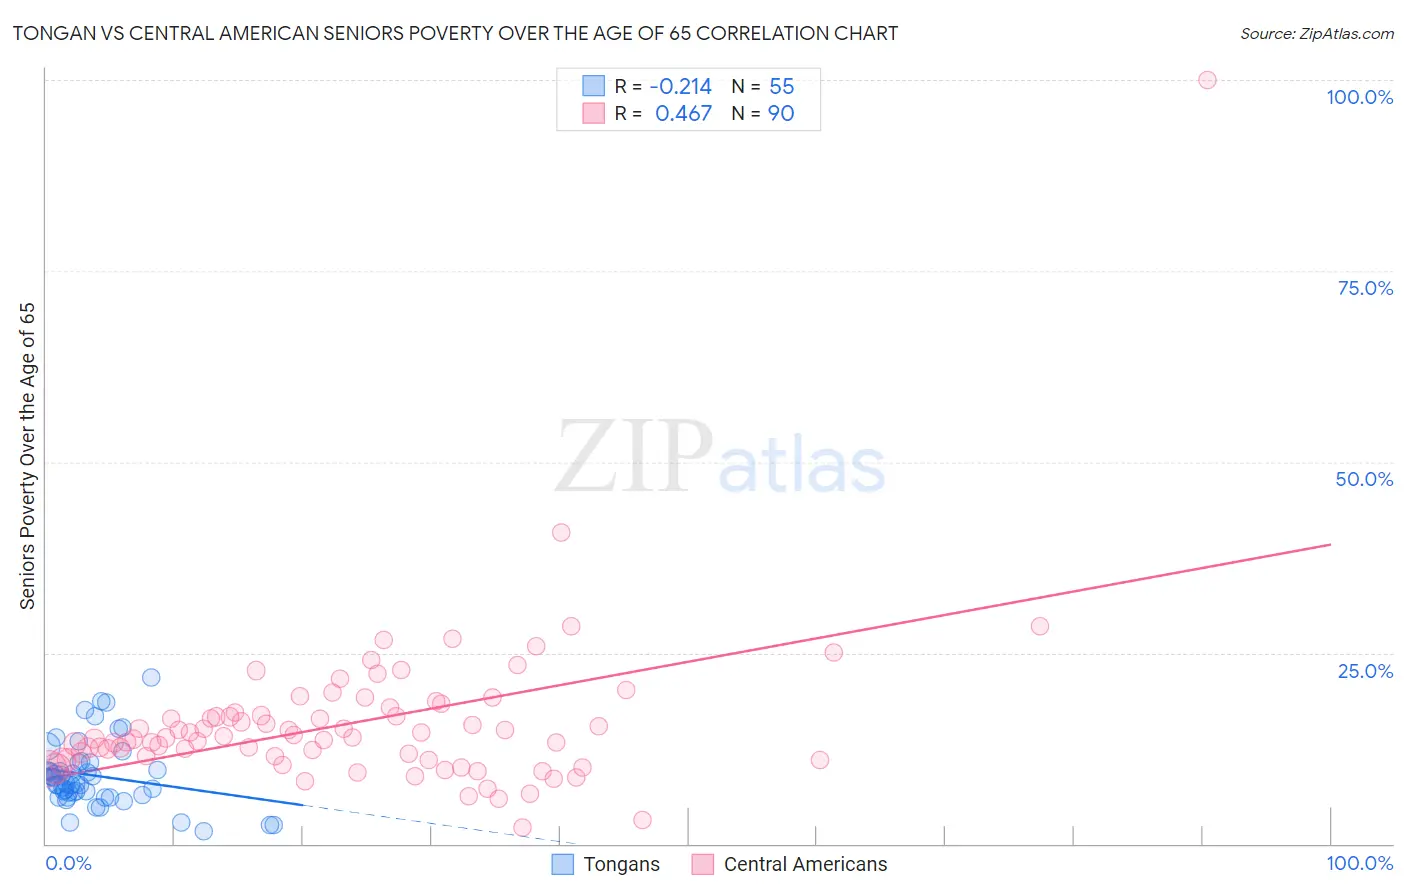
Tongan vs Central American Seniors Poverty Over the Age of 65 Correlation Chart
The statistical analysis conducted on geographies consisting of 102,677,061 people shows a weak negative correlation between the proportion of Tongans and poverty level among seniors over the age of 65 in the United States with a correlation coefficient (R) of -0.214 and weighted average of 9.3%. Similarly, the statistical analysis conducted on geographies consisting of 501,778,259 people shows a moderate positive correlation between the proportion of Central Americans and poverty level among seniors over the age of 65 in the United States with a correlation coefficient (R) of 0.467 and weighted average of 13.4%, a difference of 43.7%.
Seniors Poverty Over the Age of 65 Correlation Summary
| Measurement | Tongan | Central American |
| Minimum | 1.6% | 2.1% |
| Maximum | 21.7% | 100.0% |
| Range | 20.1% | 97.9% |
| Mean | 8.9% | 15.8% |
| Median | 7.9% | 13.9% |
| Interquartile 25% (IQ1) | 6.4% | 11.0% |
| Interquartile 75% (IQ3) | 10.6% | 17.2% |
| Interquartile Range (IQR) | 4.3% | 6.3% |
| Standard Deviation (Sample) | 4.3% | 10.8% |
| Standard Deviation (Population) | 4.2% | 10.8% |
Similar Demographics by Seniors Poverty Over the Age of 65
Demographics Similar to Tongans by Seniors Poverty Over the Age of 65
In terms of seniors poverty over the age of 65, the demographic groups most similar to Tongans are Italian (9.3%, a difference of 0.20%), Immigrants from Scotland (9.3%, a difference of 0.27%), Irish (9.3%, a difference of 0.30%), Bhutanese (9.3%, a difference of 0.32%), and Menominee (9.4%, a difference of 0.48%).
| Demographics | Rating | Rank | Seniors Poverty Over the Age of 65 |
| Luxembourgers | 99.9 /100 | #21 | Exceptional 9.2% |
| Slovenes | 99.9 /100 | #22 | Exceptional 9.3% |
| Welsh | 99.9 /100 | #23 | Exceptional 9.3% |
| Bulgarians | 99.9 /100 | #24 | Exceptional 9.3% |
| Irish | 99.9 /100 | #25 | Exceptional 9.3% |
| Immigrants | Scotland | 99.9 /100 | #26 | Exceptional 9.3% |
| Italians | 99.9 /100 | #27 | Exceptional 9.3% |
| Tongans | 99.9 /100 | #28 | Exceptional 9.3% |
| Bhutanese | 99.9 /100 | #29 | Exceptional 9.3% |
| Menominee | 99.8 /100 | #30 | Exceptional 9.4% |
| Finns | 99.8 /100 | #31 | Exceptional 9.4% |
| Northern Europeans | 99.8 /100 | #32 | Exceptional 9.4% |
| Native Hawaiians | 99.8 /100 | #33 | Exceptional 9.4% |
| British | 99.8 /100 | #34 | Exceptional 9.4% |
| Latvians | 99.8 /100 | #35 | Exceptional 9.5% |
Demographics Similar to Central Americans by Seniors Poverty Over the Age of 65
In terms of seniors poverty over the age of 65, the demographic groups most similar to Central Americans are Senegalese (13.3%, a difference of 0.82%), Colville (13.5%, a difference of 0.89%), Guatemalan (13.5%, a difference of 1.1%), Immigrants from Senegal (13.6%, a difference of 1.4%), and Immigrants from Mexico (13.6%, a difference of 1.5%).
| Demographics | Rating | Rank | Seniors Poverty Over the Age of 65 |
| Immigrants | Azores | 0.0 /100 | #276 | Tragic 12.9% |
| Paiute | 0.0 /100 | #277 | Tragic 12.9% |
| Immigrants | Bahamas | 0.0 /100 | #278 | Tragic 13.0% |
| Mexicans | 0.0 /100 | #279 | Tragic 13.1% |
| Yuman | 0.0 /100 | #280 | Tragic 13.1% |
| Immigrants | El Salvador | 0.0 /100 | #281 | Tragic 13.1% |
| Senegalese | 0.0 /100 | #282 | Tragic 13.3% |
| Central Americans | 0.0 /100 | #283 | Tragic 13.4% |
| Colville | 0.0 /100 | #284 | Tragic 13.5% |
| Guatemalans | 0.0 /100 | #285 | Tragic 13.5% |
| Immigrants | Senegal | 0.0 /100 | #286 | Tragic 13.6% |
| Immigrants | Mexico | 0.0 /100 | #287 | Tragic 13.6% |
| Belizeans | 0.0 /100 | #288 | Tragic 13.6% |
| Jamaicans | 0.0 /100 | #289 | Tragic 13.6% |
| Immigrants | Central America | 0.0 /100 | #290 | Tragic 13.6% |