Immigrants from Lithuania vs Apache Child Poverty Under the Age of 5
COMPARE
Immigrants from Lithuania
Apache
Child Poverty Under the Age of 5
Child Poverty Under the Age of 5 Comparison
Immigrants from Lithuania
Apache
14.1%
CHILD POVERTY UNDER THE AGE OF 5
99.9/ 100
METRIC RATING
26th/ 347
METRIC RANK
25.0%
CHILD POVERTY UNDER THE AGE OF 5
0.0/ 100
METRIC RATING
332nd/ 347
METRIC RANK
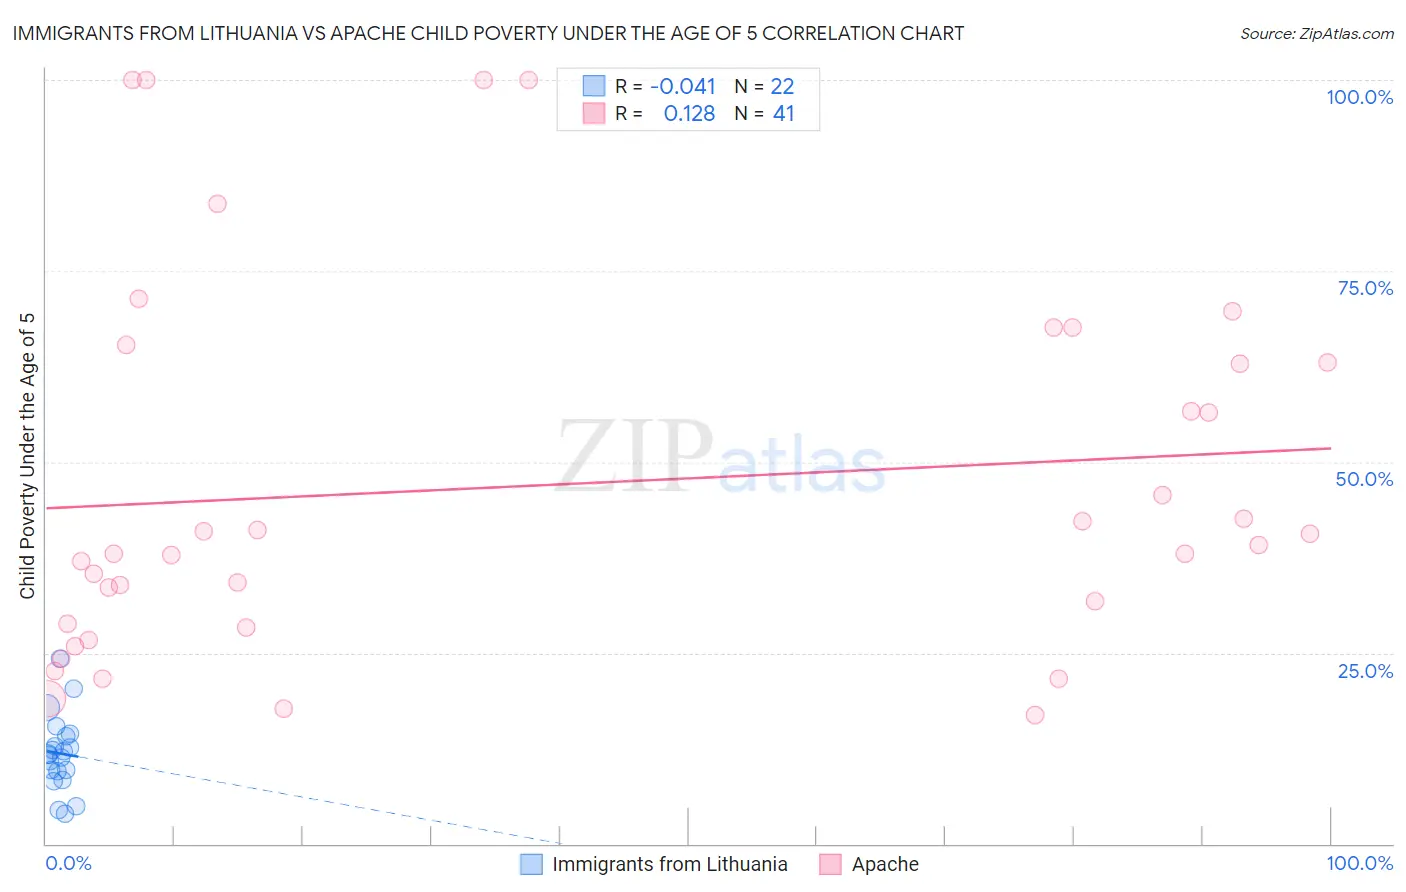
Immigrants from Lithuania vs Apache Child Poverty Under the Age of 5 Correlation Chart
The statistical analysis conducted on geographies consisting of 114,250,981 people shows no correlation between the proportion of Immigrants from Lithuania and poverty level among children under the age of 5 in the United States with a correlation coefficient (R) of -0.041 and weighted average of 14.1%. Similarly, the statistical analysis conducted on geographies consisting of 227,703,796 people shows a poor positive correlation between the proportion of Apache and poverty level among children under the age of 5 in the United States with a correlation coefficient (R) of 0.128 and weighted average of 25.0%, a difference of 77.3%.
Child Poverty Under the Age of 5 Correlation Summary
| Measurement | Immigrants from Lithuania | Apache |
| Minimum | 3.9% | 16.9% |
| Maximum | 24.3% | 100.0% |
| Range | 20.4% | 83.1% |
| Mean | 11.8% | 47.1% |
| Median | 11.7% | 39.2% |
| Interquartile 25% (IQ1) | 9.6% | 28.6% |
| Interquartile 75% (IQ3) | 14.1% | 64.1% |
| Interquartile Range (IQR) | 4.5% | 35.5% |
| Standard Deviation (Sample) | 4.9% | 24.2% |
| Standard Deviation (Population) | 4.8% | 23.9% |
Similar Demographics by Child Poverty Under the Age of 5
Demographics Similar to Immigrants from Lithuania by Child Poverty Under the Age of 5
In terms of child poverty under the age of 5, the demographic groups most similar to Immigrants from Lithuania are Tongan (14.2%, a difference of 0.49%), Asian (14.0%, a difference of 0.93%), Cypriot (14.0%, a difference of 0.93%), Bulgarian (13.9%, a difference of 1.5%), and Immigrants from Indonesia (14.3%, a difference of 1.7%).
| Demographics | Rating | Rank | Child Poverty Under the Age of 5 |
| Immigrants | Ireland | 100.0 /100 | #19 | Exceptional 13.7% |
| Immigrants | Japan | 100.0 /100 | #20 | Exceptional 13.8% |
| Bolivians | 100.0 /100 | #21 | Exceptional 13.8% |
| Immigrants | Bolivia | 100.0 /100 | #22 | Exceptional 13.8% |
| Bulgarians | 99.9 /100 | #23 | Exceptional 13.9% |
| Asians | 99.9 /100 | #24 | Exceptional 14.0% |
| Cypriots | 99.9 /100 | #25 | Exceptional 14.0% |
| Immigrants | Lithuania | 99.9 /100 | #26 | Exceptional 14.1% |
| Tongans | 99.9 /100 | #27 | Exceptional 14.2% |
| Immigrants | Indonesia | 99.8 /100 | #28 | Exceptional 14.3% |
| Immigrants | Asia | 99.8 /100 | #29 | Exceptional 14.4% |
| Cambodians | 99.8 /100 | #30 | Exceptional 14.4% |
| Koreans | 99.8 /100 | #31 | Exceptional 14.4% |
| Immigrants | Sri Lanka | 99.8 /100 | #32 | Exceptional 14.4% |
| Taiwanese | 99.8 /100 | #33 | Exceptional 14.5% |
Demographics Similar to Apache by Child Poverty Under the Age of 5
In terms of child poverty under the age of 5, the demographic groups most similar to Apache are Kiowa (24.5%, a difference of 2.2%), Native/Alaskan (25.6%, a difference of 2.2%), Black/African American (25.7%, a difference of 2.8%), Colville (25.7%, a difference of 2.8%), and Creek (24.2%, a difference of 3.2%).
| Demographics | Rating | Rank | Child Poverty Under the Age of 5 |
| Immigrants | Congo | 0.0 /100 | #325 | Tragic 23.9% |
| Central American Indians | 0.0 /100 | #326 | Tragic 23.9% |
| Dominicans | 0.0 /100 | #327 | Tragic 24.0% |
| Immigrants | Dominican Republic | 0.0 /100 | #328 | Tragic 24.1% |
| Cajuns | 0.0 /100 | #329 | Tragic 24.1% |
| Creek | 0.0 /100 | #330 | Tragic 24.2% |
| Kiowa | 0.0 /100 | #331 | Tragic 24.5% |
| Apache | 0.0 /100 | #332 | Tragic 25.0% |
| Natives/Alaskans | 0.0 /100 | #333 | Tragic 25.6% |
| Blacks/African Americans | 0.0 /100 | #334 | Tragic 25.7% |
| Colville | 0.0 /100 | #335 | Tragic 25.7% |
| Sioux | 0.0 /100 | #336 | Tragic 26.9% |
| Pima | 0.0 /100 | #337 | Tragic 27.4% |
| Hopi | 0.0 /100 | #338 | Tragic 27.7% |
| Yup'ik | 0.0 /100 | #339 | Tragic 27.7% |