Native/Alaskan vs Immigrants from Bosnia and Herzegovina Single Mother Poverty
COMPARE
Native/Alaskan
Immigrants from Bosnia and Herzegovina
Single Mother Poverty
Single Mother Poverty Comparison
Natives/Alaskans
Immigrants from Bosnia and Herzegovina
36.6%
SINGLE MOTHER POVERTY
0.0/ 100
METRIC RATING
330th/ 347
METRIC RANK
29.2%
SINGLE MOTHER POVERTY
45.1/ 100
METRIC RATING
177th/ 347
METRIC RANK
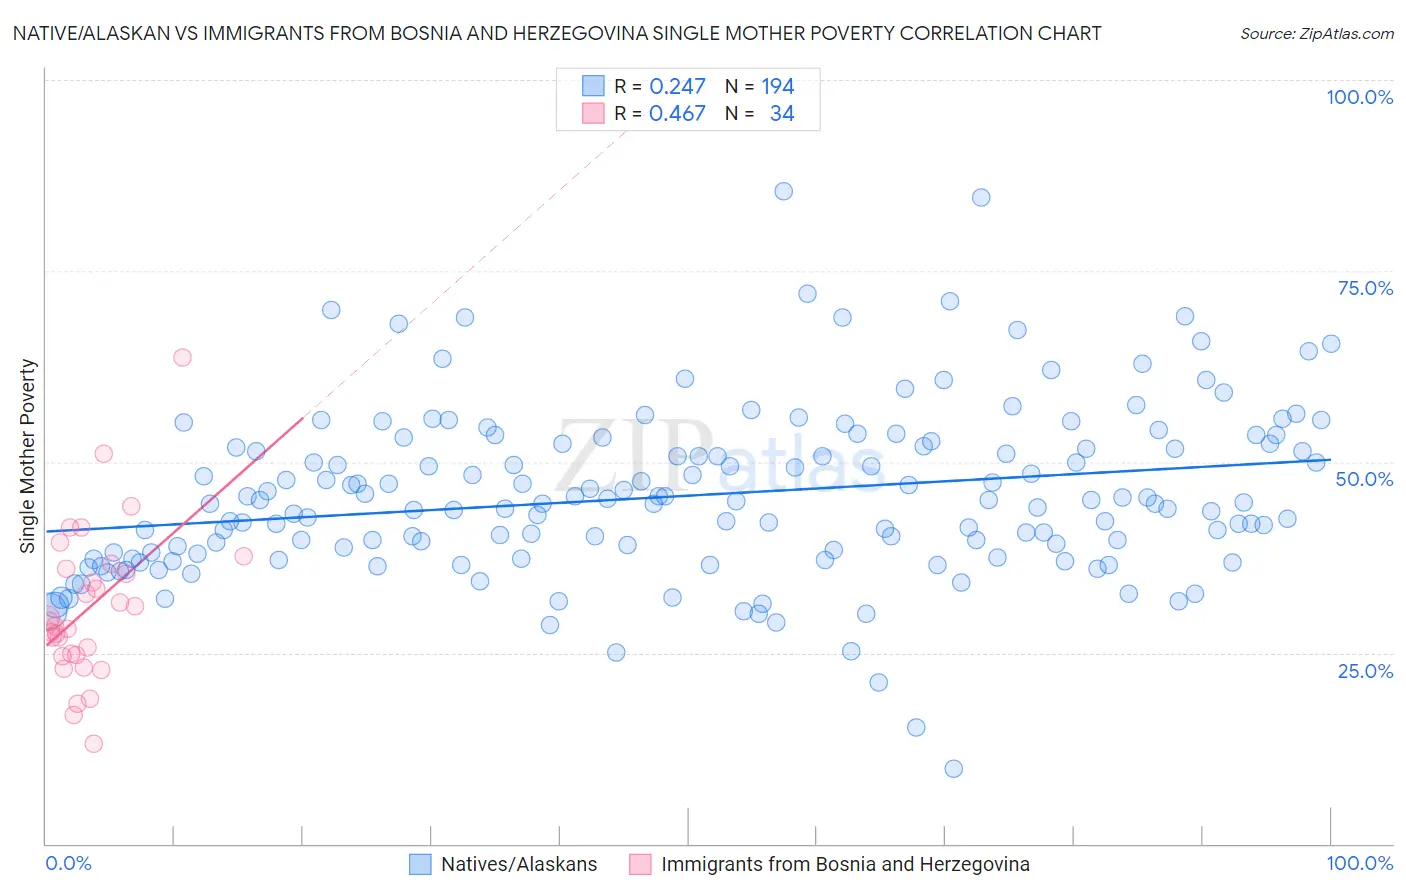
Native/Alaskan vs Immigrants from Bosnia and Herzegovina Single Mother Poverty Correlation Chart
The statistical analysis conducted on geographies consisting of 497,815,701 people shows a weak positive correlation between the proportion of Natives/Alaskans and poverty level among single mothers in the United States with a correlation coefficient (R) of 0.247 and weighted average of 36.6%. Similarly, the statistical analysis conducted on geographies consisting of 155,194,459 people shows a moderate positive correlation between the proportion of Immigrants from Bosnia and Herzegovina and poverty level among single mothers in the United States with a correlation coefficient (R) of 0.467 and weighted average of 29.2%, a difference of 25.3%.
Single Mother Poverty Correlation Summary
| Measurement | Native/Alaskan | Immigrants from Bosnia and Herzegovina |
| Minimum | 9.8% | 13.0% |
| Maximum | 85.4% | 63.6% |
| Range | 75.6% | 50.6% |
| Mean | 45.6% | 30.9% |
| Median | 44.6% | 28.8% |
| Interquartile 25% (IQ1) | 37.9% | 24.7% |
| Interquartile 75% (IQ3) | 52.0% | 35.9% |
| Interquartile Range (IQR) | 14.1% | 11.2% |
| Standard Deviation (Sample) | 11.2% | 10.0% |
| Standard Deviation (Population) | 11.2% | 9.9% |
Similar Demographics by Single Mother Poverty
Demographics Similar to Natives/Alaskans by Single Mother Poverty
In terms of single mother poverty, the demographic groups most similar to Natives/Alaskans are Apache (36.6%, a difference of 0.10%), Creek (36.7%, a difference of 0.16%), Dutch West Indian (36.8%, a difference of 0.40%), Choctaw (36.4%, a difference of 0.58%), and Yakama (36.4%, a difference of 0.64%).
| Demographics | Rating | Rank | Single Mother Poverty |
| Kiowa | 0.0 /100 | #323 | Tragic 35.5% |
| Ottawa | 0.0 /100 | #324 | Tragic 35.5% |
| Ute | 0.0 /100 | #325 | Tragic 35.7% |
| Seminole | 0.0 /100 | #326 | Tragic 35.8% |
| Yakama | 0.0 /100 | #327 | Tragic 36.4% |
| Choctaw | 0.0 /100 | #328 | Tragic 36.4% |
| Apache | 0.0 /100 | #329 | Tragic 36.6% |
| Natives/Alaskans | 0.0 /100 | #330 | Tragic 36.6% |
| Creek | 0.0 /100 | #331 | Tragic 36.7% |
| Dutch West Indians | 0.0 /100 | #332 | Tragic 36.8% |
| Menominee | 0.0 /100 | #333 | Tragic 37.1% |
| Pueblo | 0.0 /100 | #334 | Tragic 37.2% |
| Yuman | 0.0 /100 | #335 | Tragic 37.8% |
| Cheyenne | 0.0 /100 | #336 | Tragic 38.5% |
| Immigrants | Yemen | 0.0 /100 | #337 | Tragic 38.5% |
Demographics Similar to Immigrants from Bosnia and Herzegovina by Single Mother Poverty
In terms of single mother poverty, the demographic groups most similar to Immigrants from Bosnia and Herzegovina are South American Indian (29.3%, a difference of 0.090%), Immigrants from Uzbekistan (29.3%, a difference of 0.12%), Hawaiian (29.2%, a difference of 0.13%), Immigrants from Costa Rica (29.2%, a difference of 0.17%), and Immigrants from Norway (29.3%, a difference of 0.18%).
| Demographics | Rating | Rank | Single Mother Poverty |
| New Zealanders | 55.1 /100 | #170 | Average 29.1% |
| Puget Sound Salish | 55.1 /100 | #171 | Average 29.1% |
| Carpatho Rusyns | 53.8 /100 | #172 | Average 29.1% |
| British | 50.6 /100 | #173 | Average 29.2% |
| Immigrants | Saudi Arabia | 50.0 /100 | #174 | Average 29.2% |
| Immigrants | Costa Rica | 48.8 /100 | #175 | Average 29.2% |
| Hawaiians | 47.8 /100 | #176 | Average 29.2% |
| Immigrants | Bosnia and Herzegovina | 45.1 /100 | #177 | Average 29.2% |
| South American Indians | 43.2 /100 | #178 | Average 29.3% |
| Immigrants | Uzbekistan | 42.6 /100 | #179 | Average 29.3% |
| Immigrants | Norway | 41.5 /100 | #180 | Average 29.3% |
| Canadians | 40.4 /100 | #181 | Average 29.3% |
| Immigrants | Eastern Africa | 38.5 /100 | #182 | Fair 29.3% |
| Nepalese | 38.3 /100 | #183 | Fair 29.3% |
| Nigerians | 38.0 /100 | #184 | Fair 29.3% |