Osage vs Egyptian Female Poverty Among 18-24 Year Olds
COMPARE
Osage
Egyptian
Female Poverty Among 18-24 Year Olds
Female Poverty Among 18-24 Year Olds Comparison
Osage
Egyptians
24.5%
FEMALE POVERTY AMONG 18-24 YEAR OLDS
0.0/ 100
METRIC RATING
317th/ 347
METRIC RANK
18.5%
FEMALE POVERTY AMONG 18-24 YEAR OLDS
99.9/ 100
METRIC RATING
59th/ 347
METRIC RANK
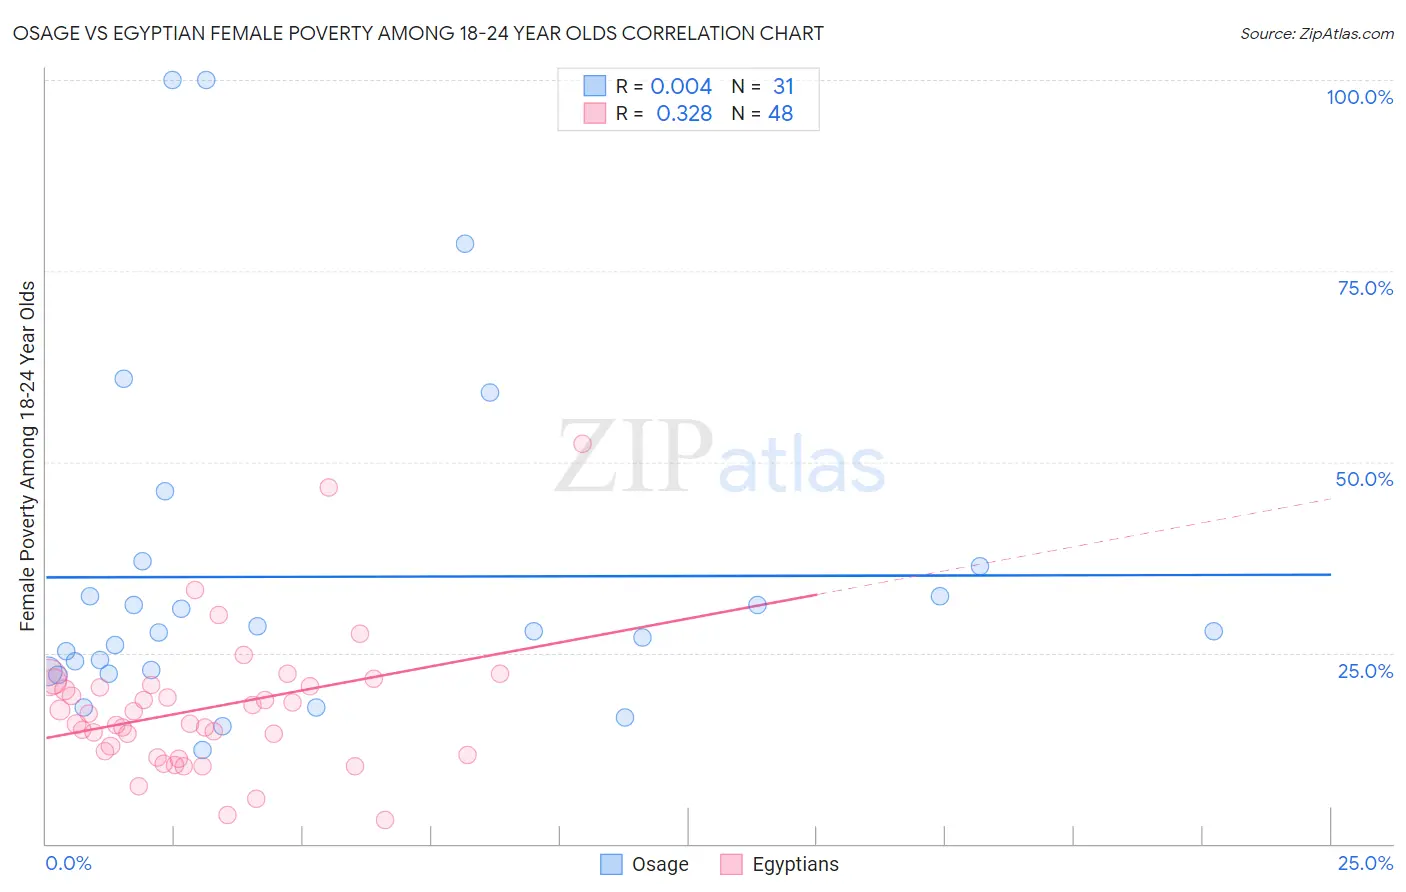
Osage vs Egyptian Female Poverty Among 18-24 Year Olds Correlation Chart
The statistical analysis conducted on geographies consisting of 91,241,953 people shows no correlation between the proportion of Osage and poverty level among females between the ages 18 and 24 in the United States with a correlation coefficient (R) of 0.004 and weighted average of 24.5%. Similarly, the statistical analysis conducted on geographies consisting of 271,963,168 people shows a mild positive correlation between the proportion of Egyptians and poverty level among females between the ages 18 and 24 in the United States with a correlation coefficient (R) of 0.328 and weighted average of 18.5%, a difference of 32.5%.
Female Poverty Among 18-24 Year Olds Correlation Summary
| Measurement | Osage | Egyptian |
| Minimum | 12.3% | 3.1% |
| Maximum | 100.0% | 52.4% |
| Range | 87.7% | 49.2% |
| Mean | 35.0% | 17.7% |
| Median | 27.8% | 16.4% |
| Interquartile 25% (IQ1) | 22.6% | 11.9% |
| Interquartile 75% (IQ3) | 36.4% | 20.7% |
| Interquartile Range (IQR) | 13.7% | 8.9% |
| Standard Deviation (Sample) | 22.3% | 9.1% |
| Standard Deviation (Population) | 21.9% | 9.0% |
Similar Demographics by Female Poverty Among 18-24 Year Olds
Demographics Similar to Osage by Female Poverty Among 18-24 Year Olds
In terms of female poverty among 18-24 year olds, the demographic groups most similar to Osage are Chickasaw (24.5%, a difference of 0.090%), Dutch West Indian (24.5%, a difference of 0.18%), Alsatian (24.4%, a difference of 0.29%), Immigrants from Congo (24.6%, a difference of 0.48%), and Black/African American (24.3%, a difference of 0.60%).
| Demographics | Rating | Rank | Female Poverty Among 18-24 Year Olds |
| Comanche | 0.0 /100 | #310 | Tragic 23.6% |
| Potawatomi | 0.0 /100 | #311 | Tragic 23.7% |
| Yuman | 0.0 /100 | #312 | Tragic 24.0% |
| Creek | 0.0 /100 | #313 | Tragic 24.2% |
| Choctaw | 0.0 /100 | #314 | Tragic 24.3% |
| Blacks/African Americans | 0.0 /100 | #315 | Tragic 24.3% |
| Alsatians | 0.0 /100 | #316 | Tragic 24.4% |
| Osage | 0.0 /100 | #317 | Tragic 24.5% |
| Chickasaw | 0.0 /100 | #318 | Tragic 24.5% |
| Dutch West Indians | 0.0 /100 | #319 | Tragic 24.5% |
| Immigrants | Congo | 0.0 /100 | #320 | Tragic 24.6% |
| Immigrants | Zaire | 0.0 /100 | #321 | Tragic 25.1% |
| Somalis | 0.0 /100 | #322 | Tragic 25.1% |
| Arapaho | 0.0 /100 | #323 | Tragic 25.2% |
| German Russians | 0.0 /100 | #324 | Tragic 25.2% |
Demographics Similar to Egyptians by Female Poverty Among 18-24 Year Olds
In terms of female poverty among 18-24 year olds, the demographic groups most similar to Egyptians are Immigrants from Ukraine (18.4%, a difference of 0.29%), Immigrants from Italy (18.4%, a difference of 0.35%), Immigrants from Brazil (18.5%, a difference of 0.36%), Immigrants from Albania (18.5%, a difference of 0.41%), and Argentinean (18.4%, a difference of 0.45%).
| Demographics | Rating | Rank | Female Poverty Among 18-24 Year Olds |
| Immigrants | Ireland | 99.9 /100 | #52 | Exceptional 18.3% |
| Italians | 99.9 /100 | #53 | Exceptional 18.3% |
| Immigrants | Egypt | 99.9 /100 | #54 | Exceptional 18.4% |
| Albanians | 99.9 /100 | #55 | Exceptional 18.4% |
| Argentineans | 99.9 /100 | #56 | Exceptional 18.4% |
| Immigrants | Italy | 99.9 /100 | #57 | Exceptional 18.4% |
| Immigrants | Ukraine | 99.9 /100 | #58 | Exceptional 18.4% |
| Egyptians | 99.9 /100 | #59 | Exceptional 18.5% |
| Immigrants | Brazil | 99.8 /100 | #60 | Exceptional 18.5% |
| Immigrants | Albania | 99.8 /100 | #61 | Exceptional 18.5% |
| Greeks | 99.8 /100 | #62 | Exceptional 18.5% |
| Immigrants | Belarus | 99.8 /100 | #63 | Exceptional 18.5% |
| Immigrants | Asia | 99.8 /100 | #64 | Exceptional 18.6% |
| Immigrants | Scotland | 99.8 /100 | #65 | Exceptional 18.6% |
| Jordanians | 99.8 /100 | #66 | Exceptional 18.6% |