Immigrants from West Indies vs Egyptian Female Poverty Among 18-24 Year Olds
COMPARE
Immigrants from West Indies
Egyptian
Female Poverty Among 18-24 Year Olds
Female Poverty Among 18-24 Year Olds Comparison
Immigrants from West Indies
Egyptians
21.0%
FEMALE POVERTY AMONG 18-24 YEAR OLDS
2.2/ 100
METRIC RATING
250th/ 347
METRIC RANK
18.5%
FEMALE POVERTY AMONG 18-24 YEAR OLDS
99.9/ 100
METRIC RATING
59th/ 347
METRIC RANK
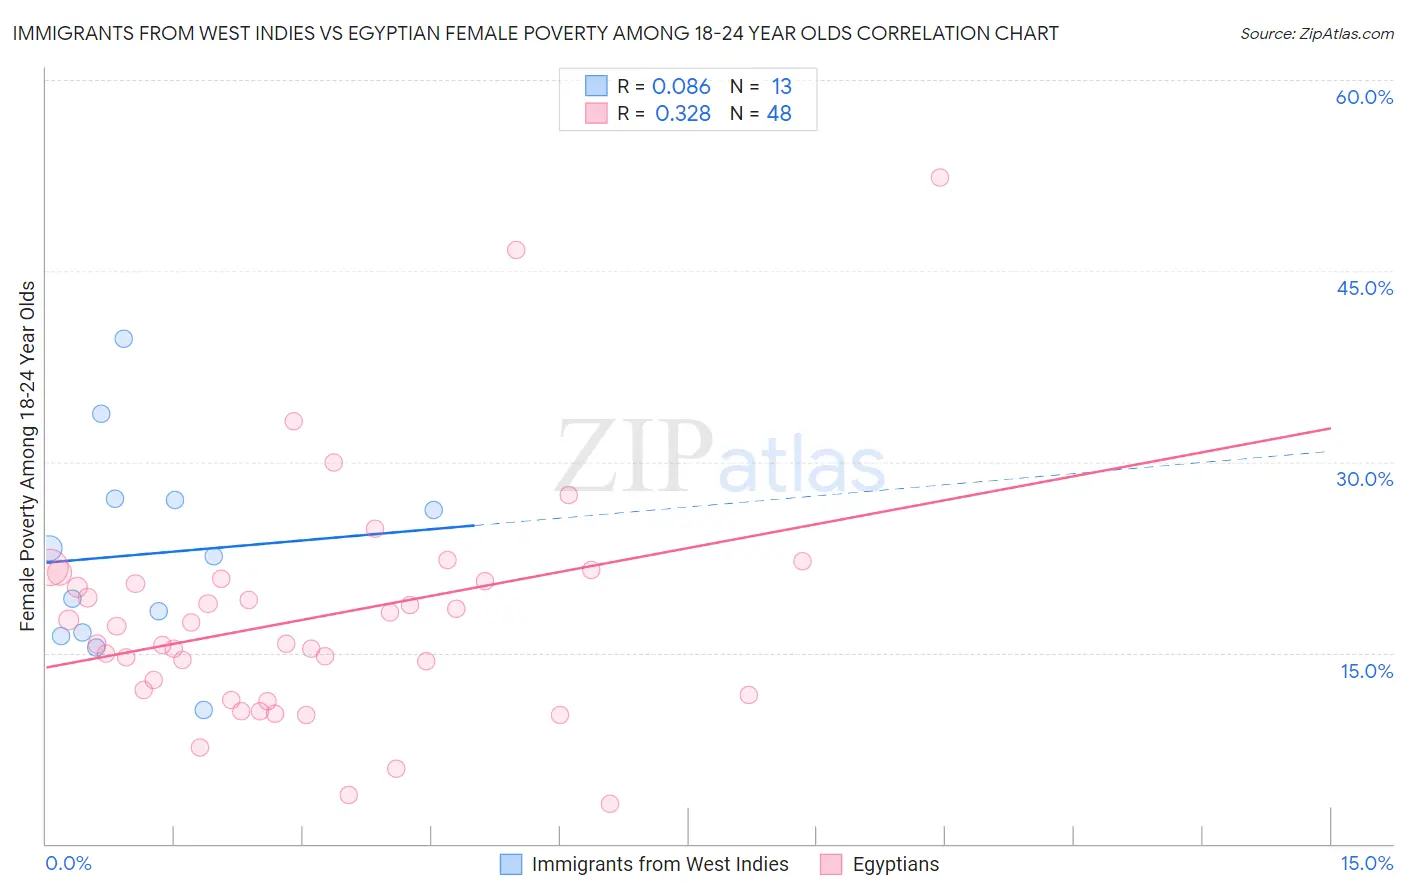
Immigrants from West Indies vs Egyptian Female Poverty Among 18-24 Year Olds Correlation Chart
The statistical analysis conducted on geographies consisting of 72,177,510 people shows a slight positive correlation between the proportion of Immigrants from West Indies and poverty level among females between the ages 18 and 24 in the United States with a correlation coefficient (R) of 0.086 and weighted average of 21.0%. Similarly, the statistical analysis conducted on geographies consisting of 271,963,168 people shows a mild positive correlation between the proportion of Egyptians and poverty level among females between the ages 18 and 24 in the United States with a correlation coefficient (R) of 0.328 and weighted average of 18.5%, a difference of 14.0%.
Female Poverty Among 18-24 Year Olds Correlation Summary
| Measurement | Immigrants from West Indies | Egyptian |
| Minimum | 10.5% | 3.1% |
| Maximum | 39.6% | 52.4% |
| Range | 29.2% | 49.2% |
| Mean | 22.8% | 17.7% |
| Median | 22.6% | 16.4% |
| Interquartile 25% (IQ1) | 16.5% | 11.9% |
| Interquartile 75% (IQ3) | 27.1% | 20.7% |
| Interquartile Range (IQR) | 10.6% | 8.9% |
| Standard Deviation (Sample) | 8.0% | 9.1% |
| Standard Deviation (Population) | 7.7% | 9.0% |
Similar Demographics by Female Poverty Among 18-24 Year Olds
Demographics Similar to Immigrants from West Indies by Female Poverty Among 18-24 Year Olds
In terms of female poverty among 18-24 year olds, the demographic groups most similar to Immigrants from West Indies are Carpatho Rusyn (21.0%, a difference of 0.13%), Immigrants from Kenya (21.0%, a difference of 0.15%), West Indian (21.1%, a difference of 0.20%), Immigrants from Africa (21.0%, a difference of 0.35%), and South African (21.1%, a difference of 0.38%).
| Demographics | Rating | Rank | Female Poverty Among 18-24 Year Olds |
| Marshallese | 3.4 /100 | #243 | Tragic 20.9% |
| Immigrants | Thailand | 3.4 /100 | #244 | Tragic 20.9% |
| Aleuts | 3.3 /100 | #245 | Tragic 20.9% |
| Immigrants | Australia | 3.1 /100 | #246 | Tragic 20.9% |
| Immigrants | Africa | 3.0 /100 | #247 | Tragic 21.0% |
| Immigrants | Kenya | 2.5 /100 | #248 | Tragic 21.0% |
| Carpatho Rusyns | 2.5 /100 | #249 | Tragic 21.0% |
| Immigrants | West Indies | 2.2 /100 | #250 | Tragic 21.0% |
| West Indians | 1.9 /100 | #251 | Tragic 21.1% |
| South Africans | 1.6 /100 | #252 | Tragic 21.1% |
| Delaware | 1.6 /100 | #253 | Tragic 21.1% |
| British West Indians | 1.2 /100 | #254 | Tragic 21.2% |
| Immigrants | Grenada | 1.2 /100 | #255 | Tragic 21.2% |
| Tsimshian | 1.0 /100 | #256 | Tragic 21.2% |
| Taiwanese | 1.0 /100 | #257 | Tragic 21.2% |
Demographics Similar to Egyptians by Female Poverty Among 18-24 Year Olds
In terms of female poverty among 18-24 year olds, the demographic groups most similar to Egyptians are Immigrants from Ukraine (18.4%, a difference of 0.29%), Immigrants from Italy (18.4%, a difference of 0.35%), Immigrants from Brazil (18.5%, a difference of 0.36%), Immigrants from Albania (18.5%, a difference of 0.41%), and Argentinean (18.4%, a difference of 0.45%).
| Demographics | Rating | Rank | Female Poverty Among 18-24 Year Olds |
| Immigrants | Ireland | 99.9 /100 | #52 | Exceptional 18.3% |
| Italians | 99.9 /100 | #53 | Exceptional 18.3% |
| Immigrants | Egypt | 99.9 /100 | #54 | Exceptional 18.4% |
| Albanians | 99.9 /100 | #55 | Exceptional 18.4% |
| Argentineans | 99.9 /100 | #56 | Exceptional 18.4% |
| Immigrants | Italy | 99.9 /100 | #57 | Exceptional 18.4% |
| Immigrants | Ukraine | 99.9 /100 | #58 | Exceptional 18.4% |
| Egyptians | 99.9 /100 | #59 | Exceptional 18.5% |
| Immigrants | Brazil | 99.8 /100 | #60 | Exceptional 18.5% |
| Immigrants | Albania | 99.8 /100 | #61 | Exceptional 18.5% |
| Greeks | 99.8 /100 | #62 | Exceptional 18.5% |
| Immigrants | Belarus | 99.8 /100 | #63 | Exceptional 18.5% |
| Immigrants | Asia | 99.8 /100 | #64 | Exceptional 18.6% |
| Immigrants | Scotland | 99.8 /100 | #65 | Exceptional 18.6% |
| Jordanians | 99.8 /100 | #66 | Exceptional 18.6% |