Immigrants from Nicaragua vs Egyptian Female Poverty Among 18-24 Year Olds
COMPARE
Immigrants from Nicaragua
Egyptian
Female Poverty Among 18-24 Year Olds
Female Poverty Among 18-24 Year Olds Comparison
Immigrants from Nicaragua
Egyptians
17.9%
FEMALE POVERTY AMONG 18-24 YEAR OLDS
100.0/ 100
METRIC RATING
34th/ 347
METRIC RANK
18.5%
FEMALE POVERTY AMONG 18-24 YEAR OLDS
99.9/ 100
METRIC RATING
59th/ 347
METRIC RANK
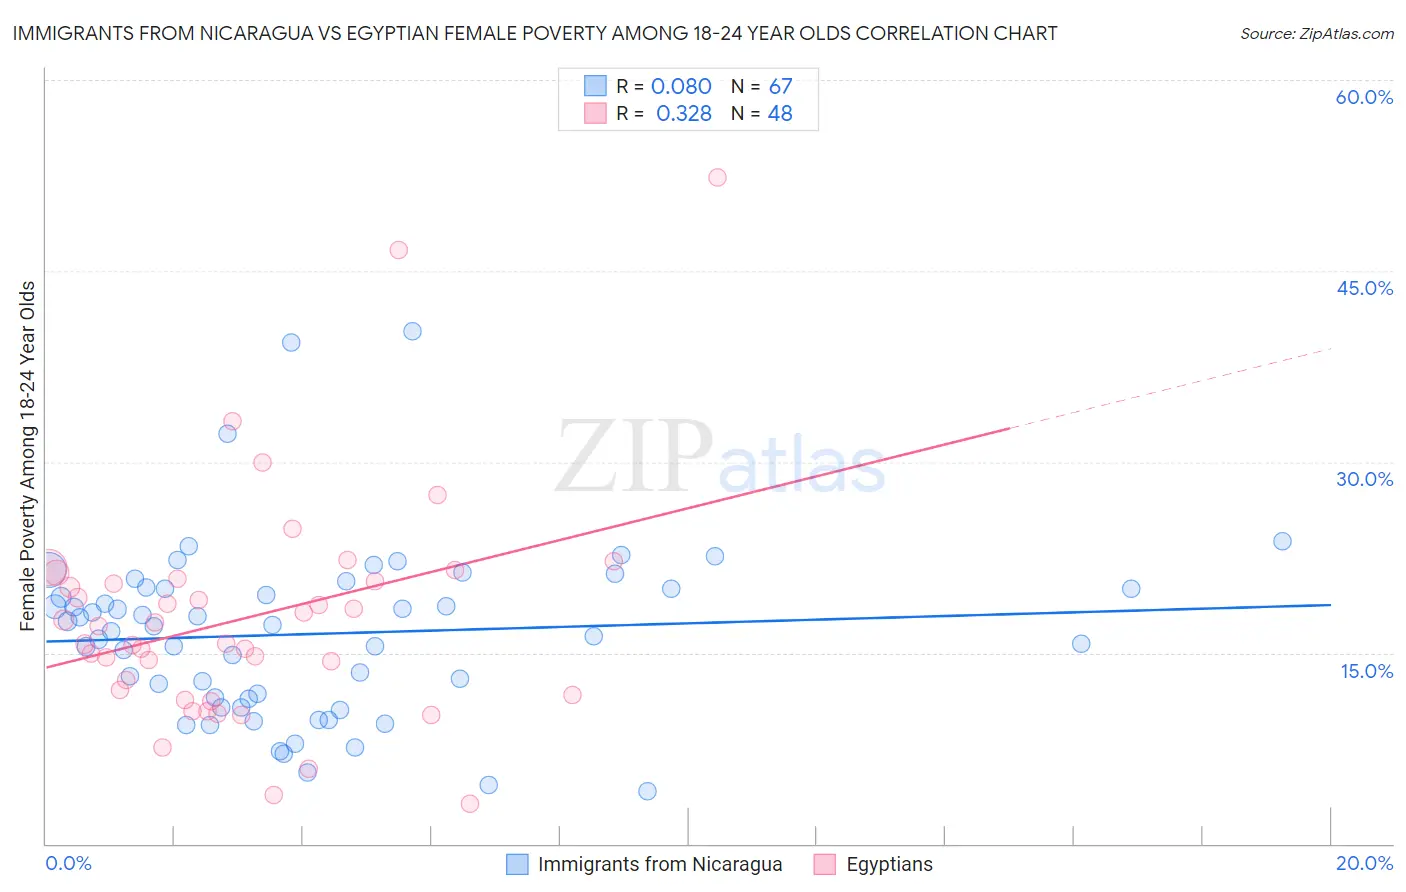
Immigrants from Nicaragua vs Egyptian Female Poverty Among 18-24 Year Olds Correlation Chart
The statistical analysis conducted on geographies consisting of 234,065,649 people shows a slight positive correlation between the proportion of Immigrants from Nicaragua and poverty level among females between the ages 18 and 24 in the United States with a correlation coefficient (R) of 0.080 and weighted average of 17.9%. Similarly, the statistical analysis conducted on geographies consisting of 271,963,168 people shows a mild positive correlation between the proportion of Egyptians and poverty level among females between the ages 18 and 24 in the United States with a correlation coefficient (R) of 0.328 and weighted average of 18.5%, a difference of 3.2%.
Female Poverty Among 18-24 Year Olds Correlation Summary
| Measurement | Immigrants from Nicaragua | Egyptian |
| Minimum | 4.2% | 3.1% |
| Maximum | 40.3% | 52.4% |
| Range | 36.1% | 49.2% |
| Mean | 16.5% | 17.7% |
| Median | 17.1% | 16.4% |
| Interquartile 25% (IQ1) | 11.4% | 11.9% |
| Interquartile 75% (IQ3) | 20.0% | 20.7% |
| Interquartile Range (IQR) | 8.6% | 8.9% |
| Standard Deviation (Sample) | 6.9% | 9.1% |
| Standard Deviation (Population) | 6.8% | 9.0% |
Similar Demographics by Female Poverty Among 18-24 Year Olds
Demographics Similar to Immigrants from Nicaragua by Female Poverty Among 18-24 Year Olds
In terms of female poverty among 18-24 year olds, the demographic groups most similar to Immigrants from Nicaragua are Immigrants from Greece (17.9%, a difference of 0.040%), Immigrants from South America (17.9%, a difference of 0.090%), Native Hawaiian (17.9%, a difference of 0.12%), Immigrants from Moldova (17.9%, a difference of 0.14%), and Immigrants from Croatia (17.9%, a difference of 0.14%).
| Demographics | Rating | Rank | Female Poverty Among 18-24 Year Olds |
| Colombians | 100.0 /100 | #27 | Exceptional 17.7% |
| Venezuelans | 100.0 /100 | #28 | Exceptional 17.7% |
| Portuguese | 100.0 /100 | #29 | Exceptional 17.8% |
| Immigrants | South Eastern Asia | 100.0 /100 | #30 | Exceptional 17.8% |
| Immigrants | Vietnam | 100.0 /100 | #31 | Exceptional 17.8% |
| Immigrants | Moldova | 100.0 /100 | #32 | Exceptional 17.9% |
| Native Hawaiians | 100.0 /100 | #33 | Exceptional 17.9% |
| Immigrants | Nicaragua | 100.0 /100 | #34 | Exceptional 17.9% |
| Immigrants | Greece | 100.0 /100 | #35 | Exceptional 17.9% |
| Immigrants | South America | 100.0 /100 | #36 | Exceptional 17.9% |
| Immigrants | Croatia | 100.0 /100 | #37 | Exceptional 17.9% |
| South Americans | 100.0 /100 | #38 | Exceptional 18.0% |
| Puget Sound Salish | 100.0 /100 | #39 | Exceptional 18.0% |
| Immigrants | Romania | 100.0 /100 | #40 | Exceptional 18.0% |
| Immigrants | Argentina | 100.0 /100 | #41 | Exceptional 18.0% |
Demographics Similar to Egyptians by Female Poverty Among 18-24 Year Olds
In terms of female poverty among 18-24 year olds, the demographic groups most similar to Egyptians are Immigrants from Ukraine (18.4%, a difference of 0.29%), Immigrants from Italy (18.4%, a difference of 0.35%), Immigrants from Brazil (18.5%, a difference of 0.36%), Immigrants from Albania (18.5%, a difference of 0.41%), and Argentinean (18.4%, a difference of 0.45%).
| Demographics | Rating | Rank | Female Poverty Among 18-24 Year Olds |
| Immigrants | Ireland | 99.9 /100 | #52 | Exceptional 18.3% |
| Italians | 99.9 /100 | #53 | Exceptional 18.3% |
| Immigrants | Egypt | 99.9 /100 | #54 | Exceptional 18.4% |
| Albanians | 99.9 /100 | #55 | Exceptional 18.4% |
| Argentineans | 99.9 /100 | #56 | Exceptional 18.4% |
| Immigrants | Italy | 99.9 /100 | #57 | Exceptional 18.4% |
| Immigrants | Ukraine | 99.9 /100 | #58 | Exceptional 18.4% |
| Egyptians | 99.9 /100 | #59 | Exceptional 18.5% |
| Immigrants | Brazil | 99.8 /100 | #60 | Exceptional 18.5% |
| Immigrants | Albania | 99.8 /100 | #61 | Exceptional 18.5% |
| Greeks | 99.8 /100 | #62 | Exceptional 18.5% |
| Immigrants | Belarus | 99.8 /100 | #63 | Exceptional 18.5% |
| Immigrants | Asia | 99.8 /100 | #64 | Exceptional 18.6% |
| Immigrants | Scotland | 99.8 /100 | #65 | Exceptional 18.6% |
| Jordanians | 99.8 /100 | #66 | Exceptional 18.6% |